On Friday 28 August, mid-morning, the sea pulled back from the shore on several beaches in Cartagena, Spain. The city raised a red flag. By 12:30 local time the flag was yellow, and the regional emergency service attributed the event to natural causes, ruling out any risk to the public.
Metres of sand went around that morning, and they did not agree. Regional broadcaster La 7 reported “between four and five metres at some points”. Cartagena Actualidad placed its “up to about seven metres” on the Cartagena coast, and gave “between two and three” for the stretch of La Manga that belongs to San Javier. Mazarrón Noticias had it the other way round: three to five metres in the south and up to seven in the north, “already in San Javier”.
From two to seven metres, and the same stretch of beach, the San Javier one, carrying two figures five metres apart. That is how an eyeball estimate made in a hurry and from the sand behaves, and it is exactly what an instrument is for.
At the Cartagena harbour tide gauge the sea dropped 14.8 centimetres in eight minutes that morning, between 11:03 and 11:11 local time, once waves and tide are filtered out. That is the move people watched from the sand. The data is public and the calculation is ours; the filter is further down, in case anyone wants to redo it. We did not come across this figure in the news reports from those days.
There is a second number, this one from the satellite, and it changes how the news reads. On that same beach, the waterline shifts by as much as 7.9 metres from one ordinary summer day to the next. The seven metres that were reported look a lot like what that shoreline does on any given Tuesday.
So the metres of sand do not separate 28 August from a normal day. Neither do the centimetres, and that is what we did not expect: measured across the whole week, the 28th was not the day the sea moved most at Cartagena. The big day was four days earlier, and in Murcia nobody reported it.
What the scene shows, and what it does not
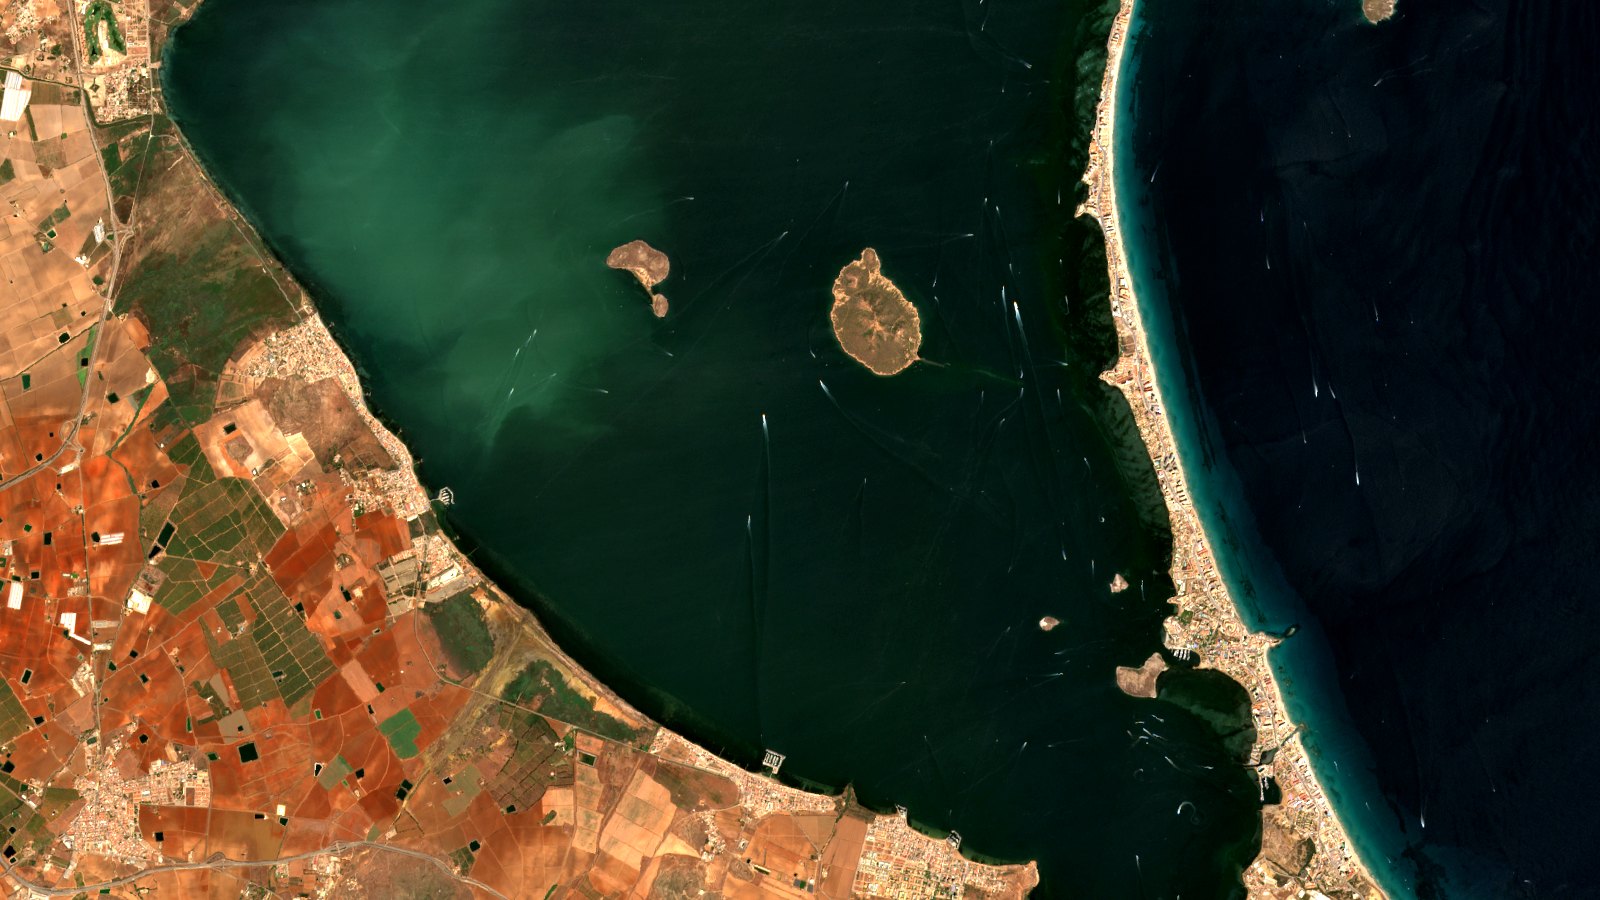
The cover is our own rendering of the 29 August pass, the first cloud-free scene after the event: true color, processed by T3 AISAT, about 18 by 10 kilometres.
On the Mediterranean side of La Manga a band of pale water hugs the beach and then gives way to very dark blue. That colour jump is misleading: it is not the edge of a drop-off. Two kilometres out from the shore, on the northern stretch of La Manga, the seabed is still at twenty-one metres. What happens is that the water stops returning light long before the bottom runs out.
And what the scene does not tell you is how high the water was. An optical image does not carry sea level inside it: you have to put it alongside. That is the lesson we took from measuring the tide that is not in the Sentinel-2 photo in Guinea-Bissau. When Sentinel-2 passed on 29 August the sea was about 9 centimetres below the mean of the ten images from this summer that we compare further down.
The centimetres
On this coast sea level is measured by Spain’s National Geographic Institute, at the port of Cartagena. Its own page warns what its observed-data files are: “Datos directos de observación, sin proceso de control y revisión”, direct observation data with no quality control or review.
That port also has a station in the UNESCO sea level monitoring network, sampling every six seconds. That is where these centimetres come from.
A harbour tide gauge picks up three things at once. The tide, small and slow in the Mediterranean. The waves, which run in seconds. And in between, the one that matters here: the band of periods measured in minutes. That is where the literature places a meteotsunami, a long wave driven by the atmosphere rather than by an earthquake: waves “with a period of between 2 and 120 min”, per Lewis and colleagues in Natural Hazards and Earth System Sciences.
The filter is short to explain. We average the series to one value per minute, apply a five-minute running mean, which removes the waves, and subtract a two-hour one, which removes the tide. That running mean also clips some of the oscillation itself, so every figure here is a conservative estimate: the raw amplitude is somewhat larger, not smaller.
| Day | Largest move of the sea | How often it repeated |
|---|---|---|
| 24-08-2026 | 25.6 cm rising in 9 min | about 22 min |
| 25-08-2026 | 15.8 cm falling in 16 min | about 23 min |
| 26-08-2026 | 15.5 cm falling in 7 min | about 22 min |
| 27-08-2026 | 13.3 cm rising in 6 min | about 23 min |
| 28-08-2026 | 15.9 cm falling in 7 min | about 23 min |
| 29-08-2026 | 9.3 cm falling in 8 min | about 17 min |
Three things here do not match what was reported.
The first is that the 28th does not stand out. From the 25th to the 28th, four days running, the sea moved between thirteen and sixteen centimetres, in jumps lasting six to sixteen minutes. Only one of those days had a red flag.
The second is the time of day. The largest move on the 28th was not the morning one that emptied the beaches: it came at 16:29 local time, with the flag back to yellow since 12:30 and people in the water again. Nobody saw it, because fifteen centimetres spread along a beach do not show unless you are measuring.
And the third is the 24th. That day the sea rose 25.6 centimetres in nine minutes at the port of Cartagena: sixty per cent more than on the 28th, and more than any other day that week. It is the day of the Valencian coast event, the one that did reach the papers. At Gandía the sea dropped 62.1 centimetres at 11:05 local time and at Cartagena it rose 25.6 at 11:31, twenty-six minutes later.
The same phenomenon that made the news for Valencia also happened here, and harder than on the day that made the news for Murcia. And here nobody reported it.
Four days before, the same kind of event ran along the Valencian coast, and there the figure did reach the papers the next day. At Gandía the figure did reach the papers the next day. With our same filter it is 62.1 centimetres in eight minutes, two and a half times what Cartagena did that same morning. We are comparing records from two ports with different geometries, not the strength of the event on each coast. The first suspect for that difference is the shape of the seabed off each beach. Along thirty kilometres of this coast, the depth that makes the wave grow sits eight hundred metres from the shore in one place and eleven kilometres in another.
The metres
Here the satellite adds what no tide gauge can give: what the shoreline does along kilometres of beach, rather than at one point.
We measured the mean position of the waterline on the Mediterranean beach of La Manga in ten images from the summer of 2026, along 4.71 kilometres of beach. All were taken around 11:00 universal time, which in August is close to 13:00 on this coast.
Between the day with the least beach and the day with the most there are 7.9 metres, plus or minus 0.6. None of those ten days had a red flag or emergency calls on record. One is worth flagging: 29 August is the day after the event.
Our 7.9 metres and the seven in the press are not the same number, and that is worth saying before setting them side by side.
Theirs is what somebody saw at one point on the beach, by eye and in a hurry. Ours is the average of almost five kilometres measured on images, and an average over five kilometres moves less than any single spot.
They also measure different things. The seven metres in the press are one morning’s retreat. Our 7.9 is the difference between the day with the least beach and the day with the most, across ten days of that summer. Comparing the same thing with the same thing: the day with the most beach had 3.1 metres more than an average one of those ten.
With that in front of it, what is left is the comparison that matters: a few metres of sand, on their own, are not enough to separate 28 August from any ordinary Tuesday.
So what did happen on the 28th?
Something real happened, and the flags were the right call. What did not happen is that it was exceptional.
We also looked at the other half of the record, the half the filter throws away: the slow changes, the ones that take hours. These are different numbers and they do not compare with the ones in the table above, because here we are not measuring the largest jump over a few minutes but how far the sea moved slowly across the day. If the air had been pushing little by little, the 28th would have to stand out there too. It does not.
The two sit together. Oceanographer Francisco López Castejón described a change that “normally takes days to happen, but here it happened in barely 12 hours”. That fits a whole week of movement, which is what the table shows, better than a single morning.
What does set the 28th apart is in the table, in a column easy to skip: the direction. On the 24th the largest move was a rise, and a rising sea uncovers no sand and leaves nobody staring at the bottom. On the morning of the 28th it was a fall, and on a gently sloping beach a fall shows from a long way off.
What made 28 August special was not the size of the oscillation. It was that it was seen.
What decision this supports
For whoever decides whether to raise a flag, this week suggests that the useful signal is not on the beach. It is in the minute-long oscillations recorded by the nearest tide gauge.
Suggest, not prove: one week is not a baseline. A retreat of several metres can be a resonance event or a rough day on a gently sloping beach, and from the sand the two look alike. A series sampling every few seconds does have what it takes to tell them apart, and that data is open and near real time. What is missing is a full summer of baseline, with its percentiles and its false positives. That is the next job.
There is also a question of where the instruments are, and the comparison with Valencia shows it clearly. There the figure was available the next day because the port of Gandia has a tide gauge run by the national ports authority. In the National Geographic Institute network, the entire coast of the Region of Murcia is covered from a single point, inside a harbour, twenty-five kilometres from La Manga.
For tides and mean level, which is what that network measures, one point is enough. For an oscillation of minutes that amplifies according to the shape of each stretch of coast, physics says no: two neighbouring stretches respond differently.
Here it is metres of sand and centimetres of sea, as in the low water on the Rhine it was a depth and a width. Putting those two halves on the same timeline, with the same declared uncertainty, is the work we do in marine and coastal monitoring.
One question is left unanswered. This is our coast, so the question is ours too: with fifteen centimetres measured twenty-five kilometres away, how far did the sea move at La Manga that morning? Hundreds of people watched it happen; what was missing was an instrument to write it down. With a measuring point between Cabo de Palos and La Manga, next time we would know.