Energy: forecast the resource, run the grid

How much you will produce in the next few hours, and where the next megawatt should go: two decisions that public weather and satellite data can answer today, once turned into an operational forecast.

MTG: images every 10 min · soundings every 30 min

What you can do today

Spain leads European photovoltaics, and almost all the data the sector needs (irradiance, radiation, elevation, weather series) is public and free of charge. What is usually missing is the software that turns it into forecasts and decisions. This is what European services already support:

Solar nowcasting, 0 to 4 hours

Meteosat Third Generation delivers images every 10 minutes with 16 channels. With MTG-S1 in service since July 2026, it adds temperature and humidity soundings every 30 minutes over Europe: the physical basis to anticipate irradiance and cloud cover at very short range for solar plants.

MTG-S1 in service since 07-2026
Renewable production forecasts

CAMS feeds photovoltaic forecasting for grid balancing (the "Solar Synergy" case in the European catalog). ECMWF publishes its IFS and AIFS (AI) models as open data, under a commercial CC BY 4.0 license, with 51 probabilistic AIFS ENS scenarios since July 2025.

ECMWF AIFS: 4 cycles/day · CC BY 4.0

Site selection and solar potential

Site selection for solar, wind, and mining projects with Sentinel-2, elevation models, and CAMS radiation data. In Spain, the national PNOA LiDAR (5 or more points/m²) plus the public PVGIS API (no key needed, 30 requests per second) can estimate the potential of each rooftop in seconds.

PVGIS: open API · 30 req/s

Grid timing and asset monitoring

Galileo provides free timing for power grids and smart grids, reinforced with OSNMA authentication, operational since July 2025. In mining, Sentinel-1 InSAR supports environmental monitoring and stability checks of tailings ponds and facilities.

OSNMA operational since 07-24-2025

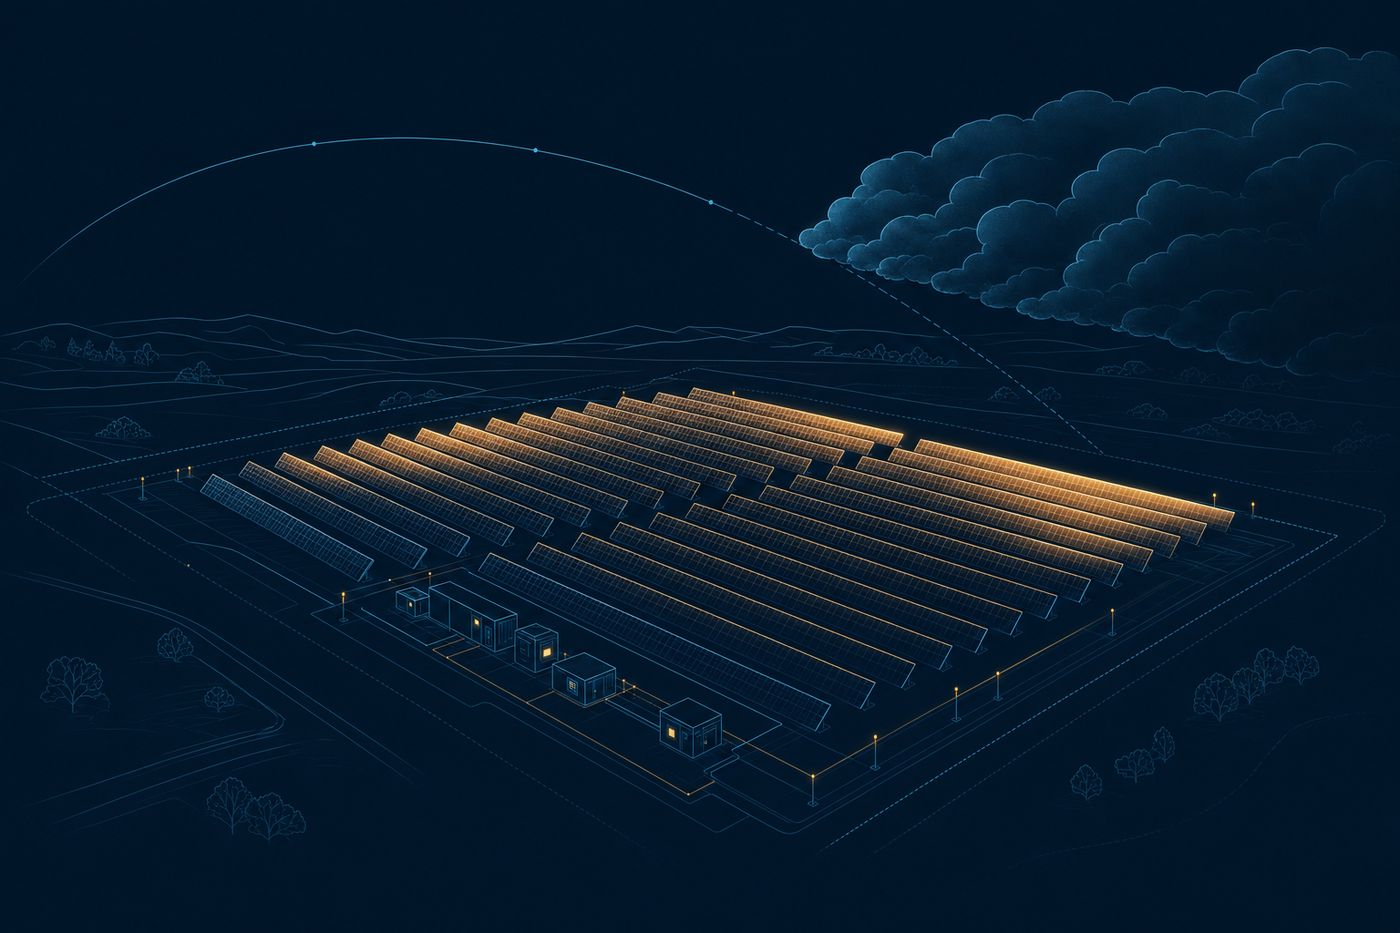
Technical illustration: a solar plant with a cloud front approaching and a forecast arc drawn ahead
Illustration: solar generation forecast as a cloud arrives.

How we make it land

We build the full pipeline: it ingests MTG, CAMS, or ECMWF, combines it with the telemetry of your plants, and delivers the forecast where you work, whether that is an API, a dashboard, or your decision support system. The cost is not in the data, which is free: it is in turning it into a number someone can act on.

Forecast the drop when a cloud arrives

Meteosat Third Generation takes an image every 10 minutes, so we watch the clouds move almost live. From their motion and from irradiance, we estimate how much light will reach the plant in the next few hours. With that 0 to 4 hour curve you can anticipate the drop in output, adjust your bid in the intraday market, and avoid imbalances that are costly to settle.

MTG · image every 10 min · 0 to 4 h horizon

Watch the vegetation under power lines

Sentinel-2 measures NDVI (an index that shows how much green leaf and vigor the vegetation has) along the power lines. Where the index grows fast, vegetation is closing in on the safe clearance. The system ranks which spans to prune and clear by real urgency, instead of walking the whole network blind, and it lowers the risk of contact and fire.

Sentinel-2 · NDVI · 5-day revisit

Choose where the next site goes

We combine the long radiation series from CAMS and PVGIS with the wind series from ERA5 (the European climate reanalysis, a consistent record spanning decades) and with the slope and aspect of the terrain. The output is an expected production estimate per site and a ranking of where the next solar or wind project pays off best, before anyone sets foot on the ground.

CAMS and ERA5 · radiation and wind · multi-year series

How much will you produce tomorrow at noon?

Tell us about your plant or portfolio. We will tell you which public dataset answers your question, and how we turn it into an operational forecast.

Talk to the team