On Monday 27 July, Reuters published the German inland navigation agency’s forecast for the Rhine: “the navigable water depth at Kaub will fall from about 35 cm on Monday to around 20 cm on Friday”. Twenty centimeters. That is the number that traveled across Europe this week, and the one that decides how much cargo a barge can carry.
Sentinel-2 cannot give you that number. It is an optical sensor, and under a murky surface there is no bed to see. And even if another sensor measured the height of the water, the Kaub figure is not a height either: it is the depth of the navigable channel, counted against a reference level rather than against the bed, as the same piece makes clear when it notes that “the river is deeper than the navigable depth”. What Sentinel-2 does measure, along tens of kilometers at a time, is something else: how much of the channel is still wet. This article is about that second quantity, about what it is worth, and about where it stops being useful.
We measured it on the Waal, the branch the Rhine takes through Gelderland on its way to Rotterdam. Along a 38.8 kilometer reach, the water surface was 1,232.2 hectares on 28 July 2026, which is a mean width of 317 meters. The six clean scenes we measured the same way in the summers of 2023, 2024 and 2025 average 1,501.5 hectares, or 386 meters. We are 17.9 percent below that average, and that gap is 269 hectares of channel that would be wet in an average earlier summer.
What the Waal scene shows
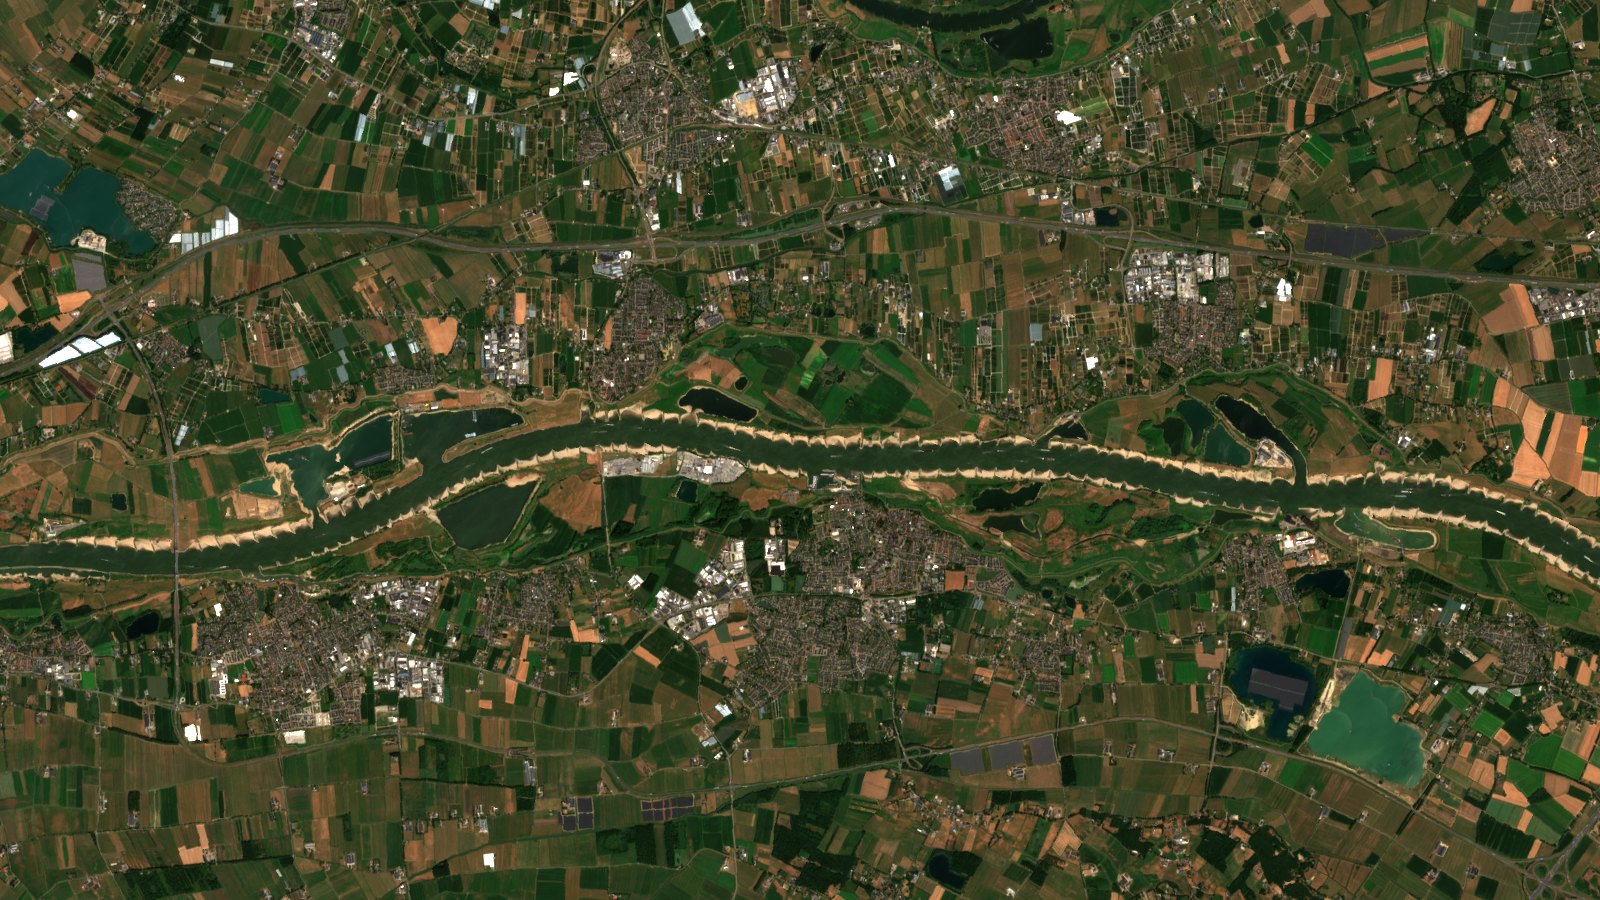
The cover image is our own reconstruction, from the Copernicus Data Space Ecosystem, of the pass of 28 July 2026 at 10:56 UTC. True color, processed by T3 AISAT, about 17 by 10 kilometers between Tiel and Dodewaard: it is the downstream end of what we measured, not the whole reach.
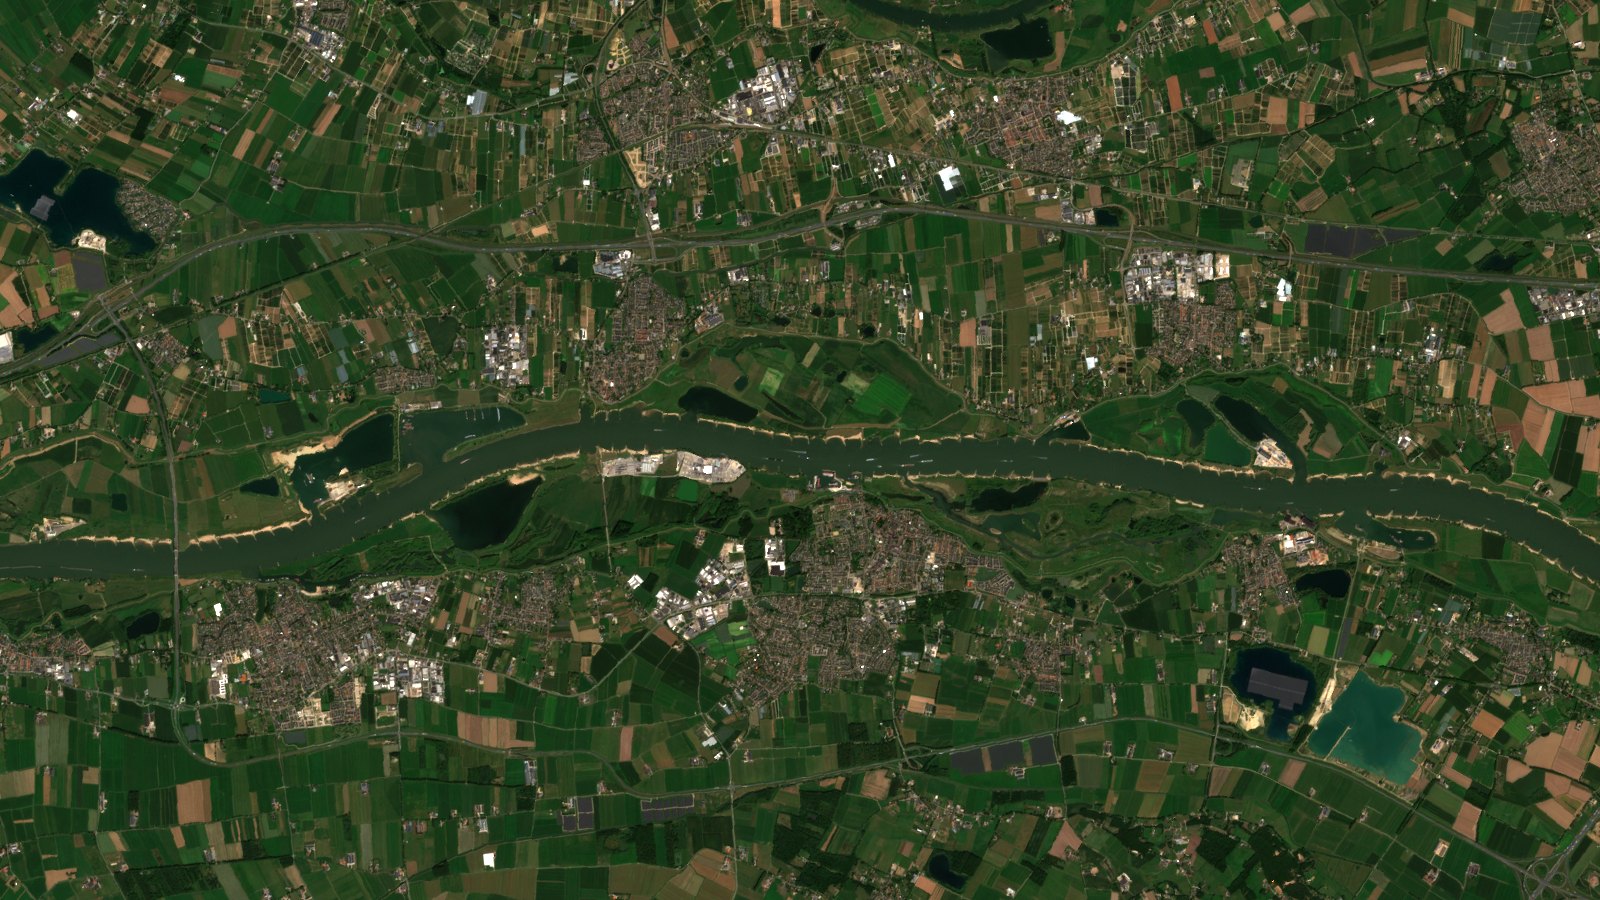
The first thing you notice is the pale strip. The Waal is trained with groynes, the low walls that run out from the bank to squeeze the channel so the water stays deep in the middle. Between one groyne and the next there is a cell that is normally submerged. In the 28 July image those cells are dry, one after another, and they draw a comb of sand along both banks. This is not a trick of the light or of the color treatment: the second figure is the same frame, the same processing and the same color transfer applied to a scene from an earlier summer, and there the pale strip is a thread.
How to measure a river surface without fooling yourself
A river is not a reservoir. When we measured the water surface of a reservoir in Slovakia it was enough to crop the basin and count. Here the frame also contains another river, two canals, dozens of gravel pit lakes and plenty of bridges that cut the water patch into pieces. Our first attempt at this measurement took the largest connected patch of water, and it failed in the most instructive way possible: from one date to the next, the largest patch was a different body of water. We were comparing different places and calling it river change.
What we do now fits in one sentence: we draw the axis of the river and always measure the same band. The axis is traced by following the water from one edge of the frame to the other, starting from a known point, the bridge at Nijmegen, and at each step keeping the stretch of water closest to the previous one. A lake does not break that tracking, because it is not where the river was an instant earlier. We then take a band a little under 500 meters wide on each side of that axis, and that band is identical for every date. The only thing that changes between scenes is the water, not the area being evaluated.
The band is wider than the river even in the fullest summer we measured: in that scene only 1.6 percent of the water surface reaches its edge. If we were clipping anything it would be in the wettest scenes, which would compress the drop we publish rather than inflate it.
Inside the band, water is separated from everything else with the MNDWI index, which compares the green band with the shortwave infrared and returns a value between -1 and +1, with water on the positive side. The Space4Water portal of the United Nations Office for Outer Space Affairs carries its definition, credited there to the ArcGIS Pro indices gallery: “The Modified Normalized Difference Water Index (MNDWI) uses green and SWIR bands for the enhancement of open water features. It also diminishes built-up area features that are often correlated with open water in other indices”. That second sentence matters here: the reach runs past Tiel and Nijmegen, and an index that mistakes a roof for water is no use.
One note on resolution: our working grid is about 18 meters across, but the band that sets the limit is the shortwave infrared, which Sentinel-2 delivers at 20 meters. That is the real detail of the measurement, not the 10 meter bands the cover image is built from.
The result on the Waal, with its margin
Eleven summer scenes from 2023 to 2026 passed the first filter. Two were dropped when we measured the cloud cover inside the river band, with the bar set at 2 percent, and the contrast shows why you have to look there and not at the whole picture: 25 June 2024 shows 2.1 percent cloud over the frame and 7.3 percent inside the band, and 13 July 2026 goes from 5.3 to 9.6. The headline scene runs the other way, and it is the case that matters most: the catalog puts 7.4 percent cloud on the full archive image, and inside the band it comes down to 0.17. Filtering on the archive figure would have thrown it away. Nine scenes are left, and over them the common measurement area is 39.59 square kilometers, 99.6 percent of the band.
The reference scene is 11 August 2025: of the most recent earlier year, the latest clean scene of the summer. It is worth saying that this is not the cautious comparison but the opposite one. At 1,539.6 hectares it sits above the mean of the six, so comparing against it widens the drop to 20.0 percent. That is why the headline number is the 17.9 percent against the mean and not the one from that pair. A pair of photos is not a series.
The separation is clean: the largest of the three 2026 scenes, the June one, holds less water than the smallest of the three previous summers. And of the 1,232.2 hectares measured on 28 July, 1,131.7 hold water in all nine scenes: that is the fixed channel, the part that never moves. So what we are measuring is not an edge tremor around a stable river, it is a variable part that has shrunk this year.
The number does not hang on the threshold either, that is on the cut you pick along that scale from -1 to +1. Moving it up and down between -0.10 and +0.20, the drop against the reference ranges from -18.9 to -21.8 percent, always in the same direction. Switching index and measuring with NDWI, which uses the near infrared instead of the shortwave, gives -18.6. And the narrowing is not concentrated in one spot: split the reach into eight five kilometer chunks and all eight lose width.
The control that tells you what the noise is worth
All of this could belong to the method rather than to the river: a change in sun, wind or turbidity moves the water edge by a few meters and the count suffers. To pin that down we applied the whole procedure, unchanged, to a body of water whose level is held on purpose: the Amsterdam-Rijnkanaal north of Tiel, a stretch between locks about 110 meters wide.
It is worth saying that we assume its level holds; we have not checked it against the operator’s records. And the canal did not come out still. Over its 10.7 measured kilometers, the nine scenes give 116.6, 118.9, 117.6, 115.1, 115.8, 122.1, 108.8, 109.8 and 116.9 hectares: a spread of 10.9 percent, with a mean of 115.7 and a standard deviation of 4.18. Translated into what actually fails, which is the edge, that deviation is 1.95 meters of bank, and that same error on a 38.8 kilometer river with two banks comes to 15.2 hectares, 0.99 percent of the surface of the reference scene.
The two scenes where the canal comes out narrowest are both from 2026. If that were a method bias specific to this year it would be inflating our drop, so it has to be subtracted. On the headline date the canal sits 4.2 percent below the reference, equivalent to 2.43 meters of bank, which on the river is 18.9 hectares: taking that off moves the drop against the reference scene from 20.0 to 18.7 percent. Two more things have to be said for that subtraction to be read properly. The reference, 11 August 2025, happens to be the canal’s maximum across the nine scenes, so the other eight come out below it by construction. And on the headline date the canal reads 116.9 hectares, above its own mean of 115.7: there is no 2026 bias demonstrated on that day, so the subtraction is an added cushion rather than the removal of a proven error.
Two more warnings about this control, both against our own result. The canal has a revetted, nearly vertical bank and the Waal a gently sloping sand beach, so the same drop in level moves more meters of edge on the river than on the canal: our 1.95 is a lower bound on the error, not its value. And in the other direction, when we propagate the edge error along all 38.8 kilometers we add it up whole, as if every stretch failed at once and in the same direction, which is the most pessimistic assumption available.
What is missing is the uncertainty that really governs a comparison between years, and it is not this one. The six scenes from 2023 to 2025 have a standard deviation of 127 hectares, 8.5 percent of their mean: eight times the noise floor of the method. Summers vary among themselves far more than the instrument fails, which is how it should be. Measured against that spread, the 269 hectare deficit of 28 July is 2.1 standard deviations. That is a clear signal, and at the same time it is a long way from the decimal precision that a one percent noise floor invites. The argument that really holds is not decimal: it is that all three 2026 scenes fall below all six earlier ones.
What the water surface does not say about draft
Here is the uncomfortable part, and it is the one in the headline. Our three 2026 scenes do not fall in a straight line. From 25 June to 15 July the water surface drops 6.1 percent. Between 15 and 28 July the water surface rises by 16 hectares, one single noise floor: between those two dates we resolve no change at all. And those are exactly the weeks of the Dutch escalation.
Three readings fit and these scenes do not decide between them. The first is that there is nothing to explain: two measurements that differ by one noise floor are two indistinguishable measurements, full stop. The second is meteorological, and it has to be handled with care on two counts: the rain Reuters mentions is the weekend of 25 and 26 July in southern Germany, too late and too far upstream to have reached Gelderland by the 28th, and the same piece says the Rhine fell anyway, “the river Rhine in Germany has fallen after weekend rain in south Germany was less than expected”. The third is geometric, and it is the interesting one: a groyne trained channel narrows until the water is confined to the navigation channel, and from there it can keep losing height while losing almost no width. If that is what is happening, the surface stops responding well before the level does.
Whichever it is, the conclusion does not depend on picking: water surface and navigable depth are different quantities and do not substitute for each other. Nor should the two numbers be read as if they came from the same place: Kaub sits on the German Middle Rhine and our reach far downstream, in another country and in a channel of different geometry. Anyone who needs to know how much cargo a barge can take has to look at the gauge and the sounding, which is exactly what Rijkswaterstaat points to when it makes available to skippers the “minst gepeilde diepten”, the minimum surveyed depths of each route. Anyone who needs to know how much channel has been left in the open air, and where, has to look from above.
This is the same lesson the Guinea-Bissau estuary taught us, where two scenes of the same coast gave different water surfaces for reasons that had nothing to do with drought. An image answers the question it is built to answer, not the one you brought with you.
What the figure we do have is good for
Against the reference scene, 322 hectares went from water to dry and only 14.7 went the other way. That ratio of more than twenty to one is hard to explain with noise, because noise has no direction. And exposed channel is good for three things. For water management: every intake, pump and gate on the bank now has the water further away, and the profile by kilometer says where to start. For the environmental report: those cells between groynes are riverside ground, and their drying now has a date and a surface. And for planning: with earlier summers measured the same way, a new year lands in a context instead of an anecdote.
The official context is published and worth linking. Copernicus tracks this drought at continental scale through its Drought Observatories. In the Netherlands, Rijkswaterstaat announced on 1 July that the national water distribution committee was moving to level 1, imminent water shortage, because “de afvoeren van de grote rivieren zijn laag, veel lager dan gemiddeld voor deze periode van het jaar”, the discharge of the large rivers is low, much lower than average for this time of year. Two weeks later it moved to level 2, actual shortage, which had not happened since August 2022, and that same piece carries the underlying figure: “er is sinds 1976 niet meer zo weinig water ons land binnengestroomd bij Lobith”. Not since 1976 has so little water flowed into the country at Lobith, which is where the Rhine crosses the border upstream of our reach.
That is the frame, and what we add is resolution. A continental indicator says a region is in drought; a scene says at which kilometer of the river, how many hectares, and with what margin. Neither replaces the other.
At T3 AISAT this is exactly the material a drought early warning is made of: a repeatable measurement, with its noise floor stated and its reference series attached, that can be recomputed on every satellite pass without changing a single parameter.
That leaves the question no image answers. If your organization decides on a gauge reading, do you know which part of your problem that gauge measures, and which part falls outside the number?
Sources: Reuters, via WHTC, 27-07-2026; Rijkswaterstaat, 01-07-2026; NOS, 16-07-2026; the Copernicus Drought Observatories; and the MNDWI definition from the Space4Water portal of UNOOSA, which cites Xu, H., International Journal of Remote Sensing 27 (14), 2006. The scenes, the water surface figures and the canal control are ours.