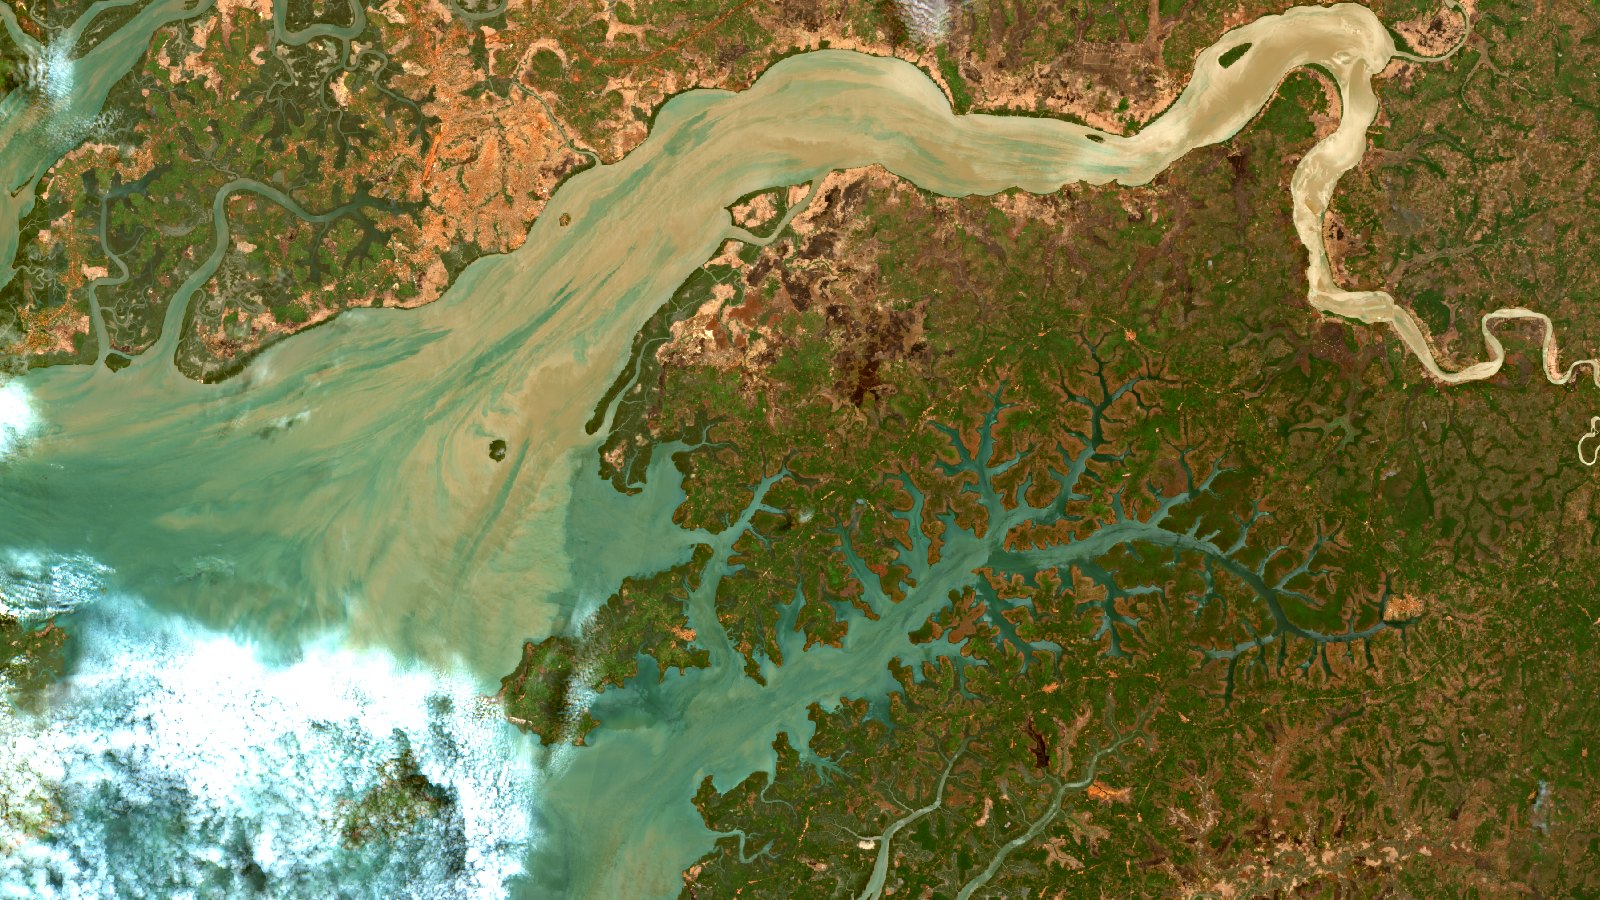
On Friday 17 July 2026, two space agencies published the same country on the same day. ESA picked Guinea-Bissau for Earth from Space, with Sentinel-2; NASA picked the Bijagós Archipelago for its Image of the Day, with Landsat 8.
One caption states a fact the other leaves out, and that fact separates a picture from a measurement. NASA writes: “Relatively low tidal waters expose sandflats and mudflats in the Bijagós Archipelago of Guinea-Bissau in this image acquired on November 28, 2025”. Low tide, stated up front. ESA dates its own scene to a month: “Captured in May 2026”. Though NASA does not give the time either, only the day, nor a height, only an adjective.
What you see in our scene
We rebuilt the frame from the Copernicus Data Space Ecosystem: 120 kilometers by 66, at about 75 meters per pixel (74 vertically). True color, using bands B04, B03 and B02, which are red, green and blue. Acquired on 18-05-2026 at 11:38 UTC.
The Canal do Geba crosses the top, wide and pale. ESA explains that color: the river carries “sediment, silt and organic matter which cause the milky colour of the water”. The lower right is the opposite: the tidal creek network of the Rio Grande de Buba, branching like a root, with mangrove in dark green mottled with rust between turquoise channels.
ESA does not publish the day of its scene, but its high resolution download is named Guinea-Bissau_S2_20260523.tif. Over our frame, which is wider, that day carries a good deal more cloud in the southwest than the one you see here, which has its own share in that corner; and the 03-05-2026 pass came out with a rectangular seam across the eastern half. We kept 18-05. It is the same check we ran shot by shot at Starina reservoir: the cloud that counts is the one over your box, not the one in the catalogue.
The number that is not in the image
On this coast the tide is the dominant variable. ESA puts it in one figure worth reading slowly, “Tidal waters soak the interior on a daily basis, reaching up to 100 km inland”. And NASA, on a 2025 study in Estuarine, Coastal and Shelf Science that it credits to Dièye and others, writes that “the region’s wide, shallow shelf and the estuary’s geometry combine to create a tidal range of up to 7 meters (23 feet), compared to about 1 meter (3 feet) in many other parts of the West African coast”.
Seven meters over a nearly flat plain moves the shoreline kilometers, twice a day. Seen from above, NASA continues, “around low tide, intertidal mudflats and sandflats emerge from the sea, causing islands to grow significantly before shrinking again hours later”: around low tide, not at any hour. So the working question is not what you see. It is what time you saw it.
Why the satellite does not hand you the tide
Sentinel-2 flies a sun synchronous orbit: the orbital plane turns with the year, so the satellite always crosses the equator at the same solar time, “a 10:30 (am) Mean Local Solar Time (MLST) at the descending node”. The mission documentation gives the reason: “This value of MLST was chosen as a compromise between a suitable level of solar illumination and the minimisation of potential cloud cover”.
You can see it in the catalog: the 57 passes over this frame between 01-11-2025 and 31-05-2026 all fall between 11:37:58 and 11:38:47 UTC. You can redo the count, with one caveat: you have to ask the catalog for the granule time, the specific frame Sentinel-2 delivers the data in, not the time of the whole product. The product time is the start of the pass, 11:21, seventeen minutes further north. It is the same trap we documented with the file name of the Veneto storm: the time that looks official is not always the real time of the shot. That 10:30 by design is at the equator; at the latitude and longitude of Guinea-Bissau it works out to 10:37 in mean solar time, day after day. The six granules in the frame were taken 21 seconds apart.
So the Sun is pinned. The tide is not: the tide follows the Moon. NOAA supplies the numbers: “a lunar day is 24 hours and 50 minutes”, “High tides occur 12 hours and 25 minutes apart”, and “It takes six hours and 12.5 minutes for the water at the shore to go from high to low, or from low to high”.
The rest you can do in your head. The lunar day runs 50 minutes longer than the solar day, so the tide arrives 50 minutes later each day against the satellite’s fixed clock. Five days apart is 250 minutes of drift: two thirds of the 372 minutes the water takes to go from high to low.
Hence the useful part: the tide comes back around after 745 minutes of drift, which is 14.9 days. Fifteen days, 30 or 45 compare tides at the same phase.
And over this frame there is no single pass every five days. The documentation still says “the twin satellites flying in the same orbit but phased at 180°, is designed to give a high revisit frequency of 5 days at the Equator”, yet the same page reports that “Sentinel-2C has replaced Sentinel-2A in operation on January 21st, 2025” and that since March 2025 the 2A flies an extension campaign, “located 36° away from Sentinel-2B”. The catalog shows the result: all 57 passes come from relative orbit R037 and all three sign them, each repeating the track every 10 days and staggered, so the gaps almost always alternate between 2, 3 and 5 days: 100, 150 and 250 minutes of drift. What counts is the spacing of your two acquisitions, not the nominal revisit.
That still leaves amplitude. The Sun pulls too, and NOAA sums it up: “When the sun, moon, and Earth are in alignment (at the time of the new or full moon), the solar tide has an additive effect on the lunar tide, creating extra-high high tides, and very low, low tides”. Those are spring tides; a week later, with the Sun and the Moon at right angles, you get neap tides. That swing lasts half a lunar month: 14.77 days, half the mean synodic month in Meeus’s phase algorithm, chapter 49, the same one we use to date the panels below. Mean is the operative word: run that algorithm over the 2026 phases and the individual new to full interval ranges from 14.0 to 15.6 days, because the lunar orbit is elliptical. It is the same number the tide phase came back at, so fifteen days hands you both, with that slack.
Four passes over the same place
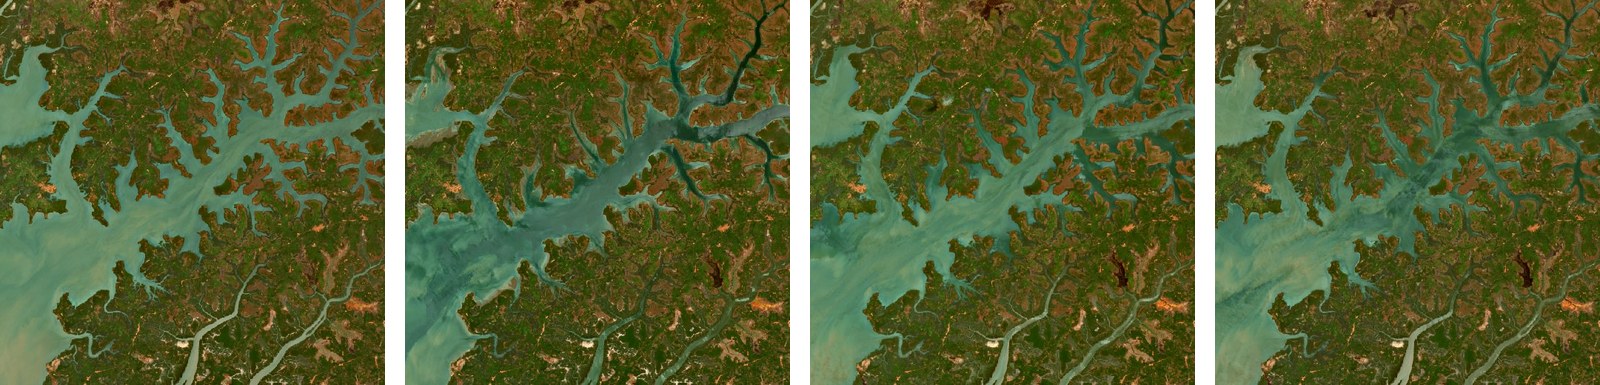
Read the experiment left to right. The first and the third sit exactly fifteen days apart: same phase by the arithmetic above, and both on spring tides, one just past full and one just past new. That is the positive control. The fourth is two days from the third, 100 minutes of drift. The second is ten days out, 500 minutes of drift, leaving it 245 short of the 745 minute cycle, and on top of that a neap tide, 1.4 days before last quarter. The lunar dates come from the same Meeus algorithm.
By eye the second one stands out: a dark, sharp edged channel against three panels of pale, diffuse water. Mean brightness agrees, 77.4 against a group of 82 to 85 out of 255.
The control that broke the easy reading
If that difference is the tide, it has to show in the water and not on the land, which does not rise and fall with the Moon. A textbook null test, one line of code away.
Fixed common mask: water is the pixels that come out water in all four panels, land the pixels that come out land in all four, so none classifies itself. That keeps 24.8 percent of the crop as water and 64.5 percent as land; the rest is shoreline. The numbers, as luminance out of 255:
| Panel | Date | Whole scene | Water | Land | Water minus land |
|---|---|---|---|---|---|
| 1 | 03-05-2026 | 84.9 | 123.6 | 66.9 | 56.8 |
| 2 | 08-05-2026 | 77.4 | 104.9 | 65.6 | 39.3 |
| 3 | 18-05-2026 | 82.5 | 115.6 | 68.7 | 46.9 |
| 4 | 20-05-2026 | 82.0 | 113.1 | 69.3 | 43.9 |
Look at the land. In relative terms panel 2 has water 9.3 percent darker than panel 3, but land 4.6 percent darker too. Land has no tide. That whole scene is dimmer: illumination, aerosols or atmospheric correction, which hit everything alike. Half the darkening of the water was accounted for before we looked at the sea.
That leaves the other half, which does belong to the water. But the last column deserves the same look, and there it turns against us. Water minus land contrast, the part illumination does not explain, puts the two day pair 3.0 points apart, the ten day pair 7.6, and the fifteen day pair, our positive control, 9.9: the widest of the three. The opposite of what the article predicts.
It is not even stable. Shrink the mask about 500 meters inland to drop the shoreline pixels, and the fifteen day control overtakes the ten day pair, which becomes the widest. A result that depends on where you put the edge of the mask is not a result.
The conclusion, the one we do not like: with four scenes and an RGB render we cannot pin what we see on the tide. In panel 2 phase and amplitude change together, it carries a whole scene darkening that is not tidal, and water color also depends on discharge, wind and waves, none of them subtracted. On top of that the positive control compares different satellites: panel 1 is 2B, panel 3 is 2C.
What survives the measurement
One thing comes out clean, and it is the one nobody mentions. Water area barely moves: 29.9, 29.9 and 30.0 percent in panels 2, 3 and 4, within a tenth of each other, and 32.6 percent in panel 1, which sits 2.7 points off: one more hint that it is not the twin the control needed. The method, so you can argue with it: an Otsu threshold, which splits the histogram at the cut that separates the two classes best, recomputed per panel on the blue channel of the JPEG. It is a poor mask: the rigorous way would be NDWI from the green and near infrared bands on reflectance, not eight bits of a render, and a self recomputing threshold tends to return similar fractions by construction. With those caveats, the message holds: at 75 meters per pixel, in a confined estuary, the shoreline does not move enough to see, even though the seven meter range NASA reports is for the Bijagós, west of this frame. Anyone measuring flooded area here will not see the tide, and that does not mean the tide is absent.
And the rest still stands: four images of the same place, same orbit, same solar time, same processing, and one does not match. We have not closed the cause; the consequence does not depend on it. Treating them as interchangeable is a method error.
What decision this changes
Guinea-Bissau lives on that swing. The World Bank WACA portal, in a piece signed by IBAP staff and carrying no visible date, records it this way: “Guinea-Bissau is a mangrove country. Mangrove forests presently cover some 326,000 hectare”, 9 percent of the national territory. And rice is grown inside that system: “Mangrove rice cultivation involves building earthen dikes to protect the rice fields from seawater ingress”.
That is where the real job appears, and the page puts it better than we could: “If the old, breeched dikes are kept in place on the margins of the abandoned rice fields, the tide may not penetrate sufficiently into the formerly cultivated areas to encourage the natural restoration of mangroves, and the soil becomes prohibitively salty and acidic”. In other words: someone has to answer whether the tide reaches an abandoned rice field. You answer that with flooded area over time, and that area depends on the tide of the day you got.
Between the two estuaries, the Ramsar site of Lagoa de Cufada protects 39,098 hectares of lake, marshes and, in the words of its own record, “extensive mudflats”. With a caveat: that record states “Most recent RIS information: 1990”, the site as it was at designation.
Four rules for jobs where the goal is to measure rather than to illustrate:
- Acquisition time is first class metadata. On a tidal coast, a date without a time is a measurement without units.
- Multiply the days between two scenes by 50 minutes and see where that lands inside the 745 of the cycle. Near 0 or near 745, same phase; halfway, no. And check the Moon: spring with spring, neap with neap.
- Before you call a difference a change, subtract the tide. Otherwise the first derivative of your mangrove series is the lunar calendar.
- And before you call a change the tide, run the null test: measure the same thing on dry land. If the land moves too, what you saw was the atmosphere. It just happened to us.
Our product, for the maritime sector, is that series tied to phase. And in case you are wondering: we do not know whether the scene above is at high or low tide, because we have not run a tide model. Here is the exact instant, 18-05-2026 at 11:38 UTC, which is what you need to work it out.
How many of the series you use to decide compare the same place in the same state, and how many are measuring the clock?