Water body status
The WISE database from the European Environment Agency reports the status of water bodies under an open license that allows commercial use: the starting point of a water quality system for irrigators or fish farms.
EEA · CC BY 4.0
How much water is left, what condition it is in, and when drought will arrive: three questions that basin authorities, irrigators, and industry ask every week, and that public data already answers.
EDO: combined drought indicator · 3 updates per month since 2012
Four applications on operational European and Spanish data, each with its license and its fine print, because the fine print is part of the service too.
The WISE database from the European Environment Agency reports the status of water bodies under an open license that allows commercial use: the starting point of a water quality system for irrigators or fish farms.
EEA · CC BY 4.0
The Global Surface Water series (Landsat, 30 m) reconstructs surface water from 1984 to 2024. The Segura basin telemetry network publishes reservoirs and flows in real time, but with no public API: normalizing that access is exactly our job.
1984-2024 series · 30 m
The European Drought Observatory publishes the combined drought indicator CDI (5 classes, since 2012, 3 times per month), along with SPI/SPEI and soil moisture, through public map services under CC BY 4.0.
CDI: 5 classes · 3 times/month
Copernicus Land provides soil moisture, evapotranspiration, phenology, and high-resolution water layers. Its data policy leaves the intellectual property of what you build entirely in your hands.
free use · the IP stays yours
Water is decided in advance: the season is planned months ahead, and restrictions arrive on their own calendar. Our job is to land the public indicators (status, volume, drought) in your system as alerts per district, reservoir, or water body, ready to act on:
Sentinel-2 and Sentinel-3 measure the color of the water, and from that we estimate chlorophyll (the sign of how much algae is present) and turbidity (how cloudy the water is with sediment). When chlorophyll climbs week after week, the risk of an algal bloom shows up. The system warns the reservoir or fish-farm manager before the problem reaches the intake.
Sentinel-2 and 3 · chlorophyll and turbidity · frequent revisit
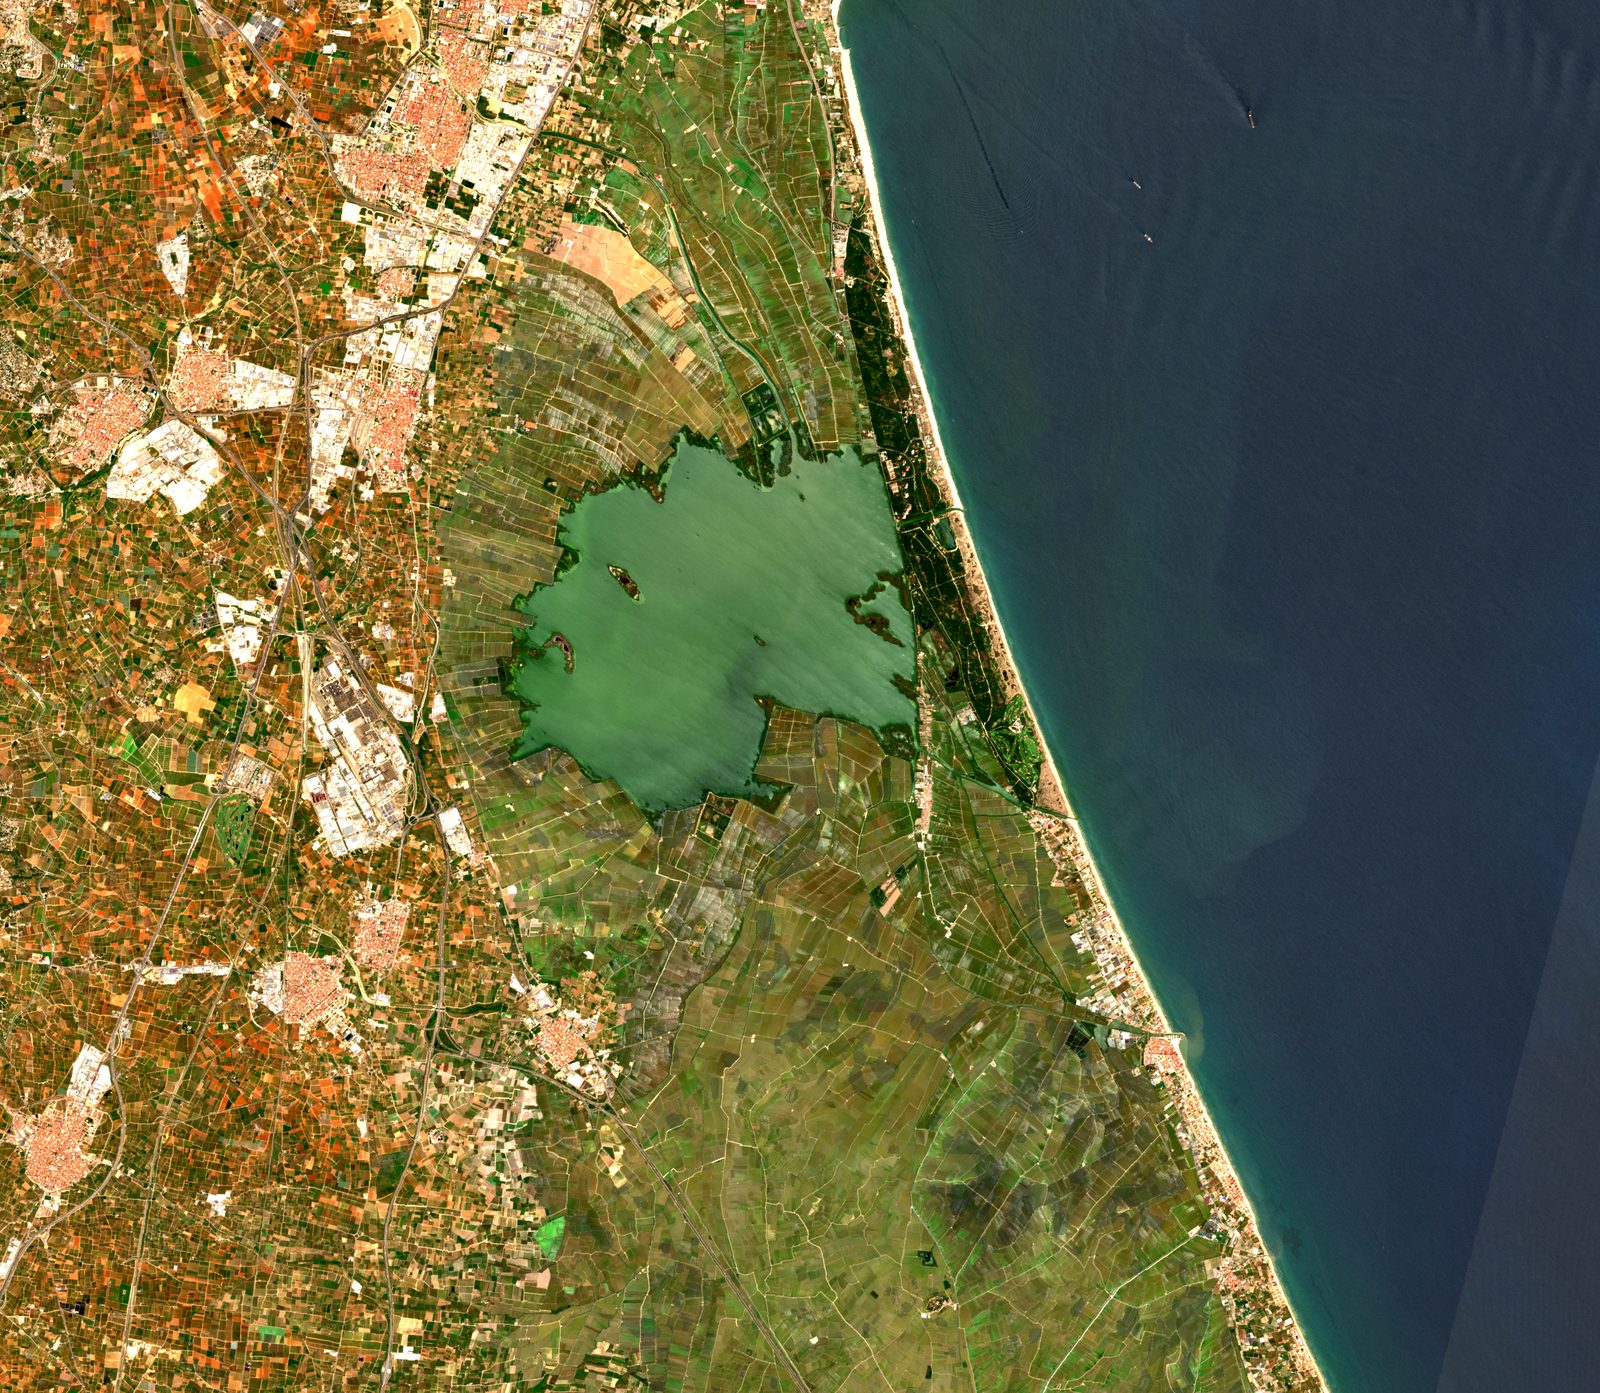
With the NDWI index (a calculation on the image that separates water from land) we map the surface of reservoirs, ponds, and wetlands on every Sentinel-2 pass. The series shows how the water rises or falls across the season. This way the stored volume and the state of a wetland like l'Albufera stop being an eyeball guess and become a number per date.
Sentinel-2 · NDWI · 5-day revisit
In coastal waters and lagoons, Sentinel-3 gives near-daily coverage of water color, and Sentinel-2 adds the fine detail. By comparing each image with what is normal for the area, we locate slicks, spills, or algal blooms that stand out from the usual pattern. The result is an alert of where to look, so inspection and sampling go straight to the right spot.
Sentinel-3 · water color · near-daily coverage
Public European drought indices by district, turned into alerts you can act on.
From weekly monitoring to the deeper question: which climate is coming, and how to adapt.
Water and soil indices over your water bodies and reservoirs, with in-house processing.
Tell us your basin and your critical points. We will tell you which public indicators watch them, and how to turn them into alerts that arrive in time.
Talk to the team