Insurance and finance: verify losses in days

After a catastrophe, the question is how much to pay, where, and when. Satellite radar already cuts that answer from weeks to days, and Spain has a verified precedent of satellite-supported claim payments.

La Palma 2021: satellite + drone + cadastre · €73.48M paid by Dec 2021

What you can do today

From underwriting risk to claims work after the event, European services and real insurance practice already meet. This is what can be verified today, with the limits included:

Loss confirmation in days

Swiss Re and ICEYE monitor floods with SAR radar: images within 24 hours of the event, and loss confirmation "in days instead of weeks or months." Damage assessment with before-and-after Copernicus imagery is part of the European catalog for the insurance segment.

images within 24 h of the event
The Spanish precedent: La Palma 2021

The Spanish public insurance compensation fund (CCS) combined satellite data (Copernicus EMS), drone flights, and cadastral maps to pay claims without on-site inspection: 1,237.3 hectares covered by lava flows and €73.48 million paid as of December 16, 2021.

2,632 claims · €73.48M paid

Parametric products on satellite indices

Parametric insurance with triggers built on Copernicus data is validated by ESA business application cases (HotPay for heat, IBISA for microinsurance, EWPIP) together with natural catastrophe risk engines per portfolio and per asset.

ESA cases: HotPay · IBISA · EWPIP

Flood exposure and early warning

Global Flood Monitoring maps water extent by processing all incoming Sentinel-1 radar in near real time with three independent algorithms, and EFAS, operational since 2012, warns of floods up to 10 days ahead. In the 2024 Valencia floods, activation EMSR773 quantified more than 53,000 affected hectares in 48 hours.

EFAS: warnings up to 10 days ahead

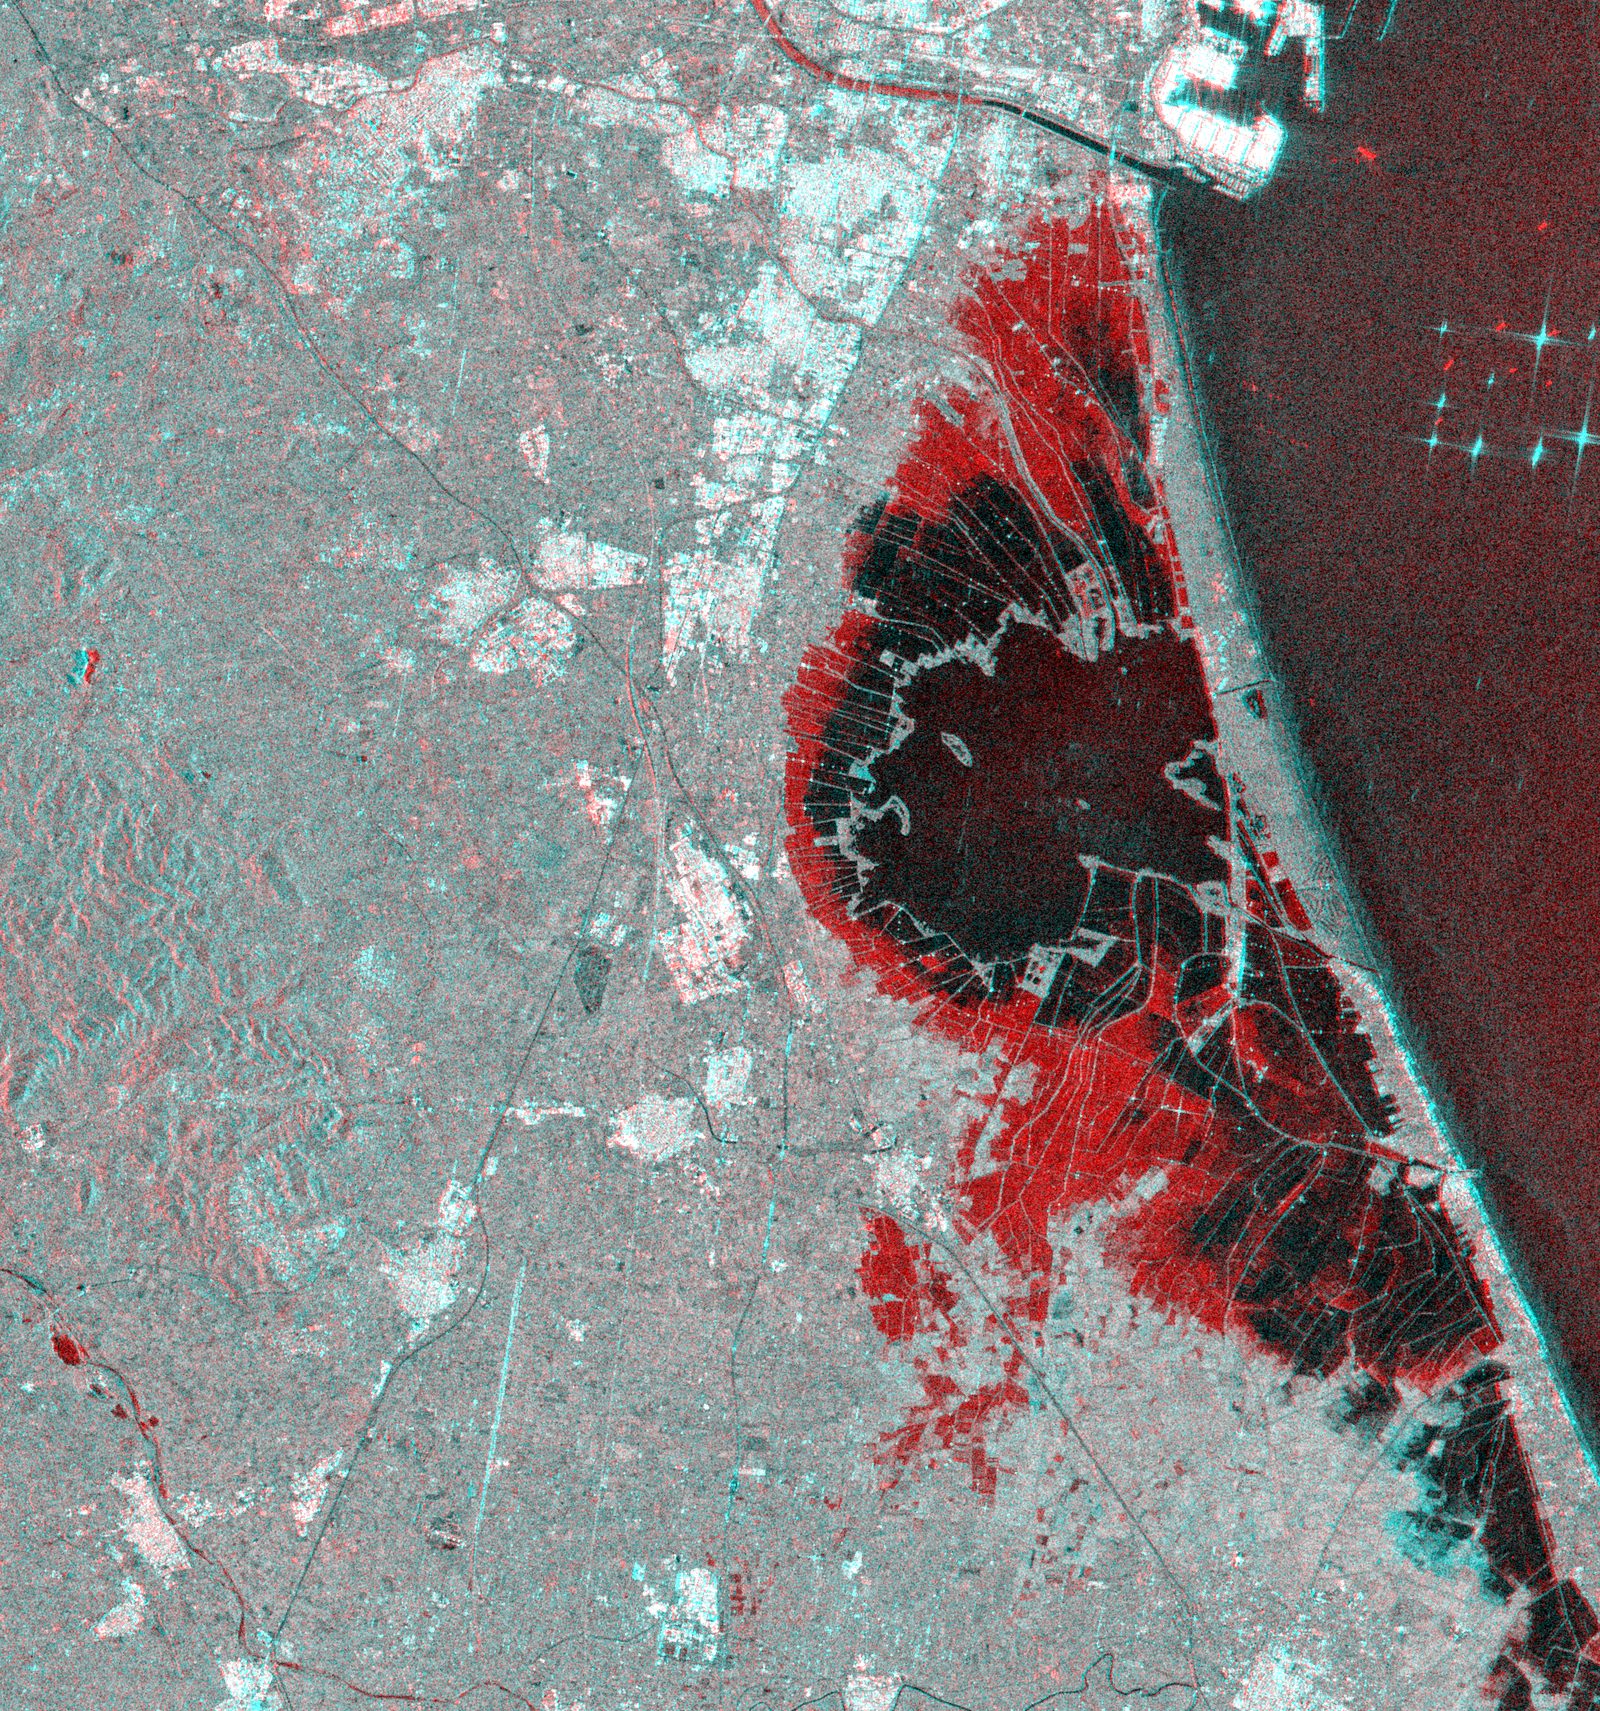
Radar change composite of the southern Valencia plain and l'Albufera: in red, surfaces where radar backscatter drops after the October 2024 flash floods: the new water extent
Sentinel-1 GRD · VV · pre 25/26-10-2024 → post 31-10/01-11-2024 · l'Albufera de ValènciaRed: radar backscatter drops after the event, new water over rice fields and farmland. Our own quick-look from open archive data (illustrative, not a CEMS product). Contains modified Copernicus Sentinel data [2024] · in-house processing.

How we make it land

One detail that defines us: in the 2024 Valencia floods (250,663 claim files and more than €4 billion paid by the CCS) the mass claims assessment was photographic and GIS-based (viewer, video assessment, and georeferenced photos), not satellite-based. The CCS satellite precedent is La Palma 2021. We will always tell you where the satellite helps, and where it does not yet.

Our work is the engine that combines Sentinel-1 radar, emergency mapping, and your portfolio to produce per-asset exposure, parametric triggers, and claims triage, always on services that are already operational.

Parametric drought cover that pays at the threshold

We take a drought index over the farm's coordinates, for example the Combined Drought Indicator (CDI) from the European Drought Observatory (EDO), which blends rainfall, soil moisture, and vegetation vigor into a single value. The policy sets a threshold: when the index crosses it for the agreed weeks, the payout triggers. The farmer is paid in days, with no field visit, and the insurer settles on a measured, auditable rule.

EDO · Combined Drought Indicator · 3 times/month

Whole-portfolio flood risk by location

We place each policy on the hazard map: official flood-prone zones and the water extent history from the Sentinel-1 archive (radar that detects water even through clouds and at night). We add up exposure by zone and by asset. The output is a risk concentration map to underwrite, price, set accumulation limits, or decide on reinsurance, before you sign and not after the loss.

Sentinel-1 (archive) · flood-prone zones · exposure per asset

A claim verified with before and after

After a flood we take one radar image from before and one from after over the risk coordinates. Where water appears, the radar signal drops, and that change composite draws the water extent, which we overlay on the insured parcel. We confirm whether the asset went underwater and how far it spread, so you can prioritize payment in days and send adjusters where they are needed most.

Sentinel-1 · change composite · before/after

How long does your claims chain take today?

Tell us about your portfolio and your risks. We will tell you what the satellite can verify, on which realistic timelines, and which precedents support it.

Talk to the team