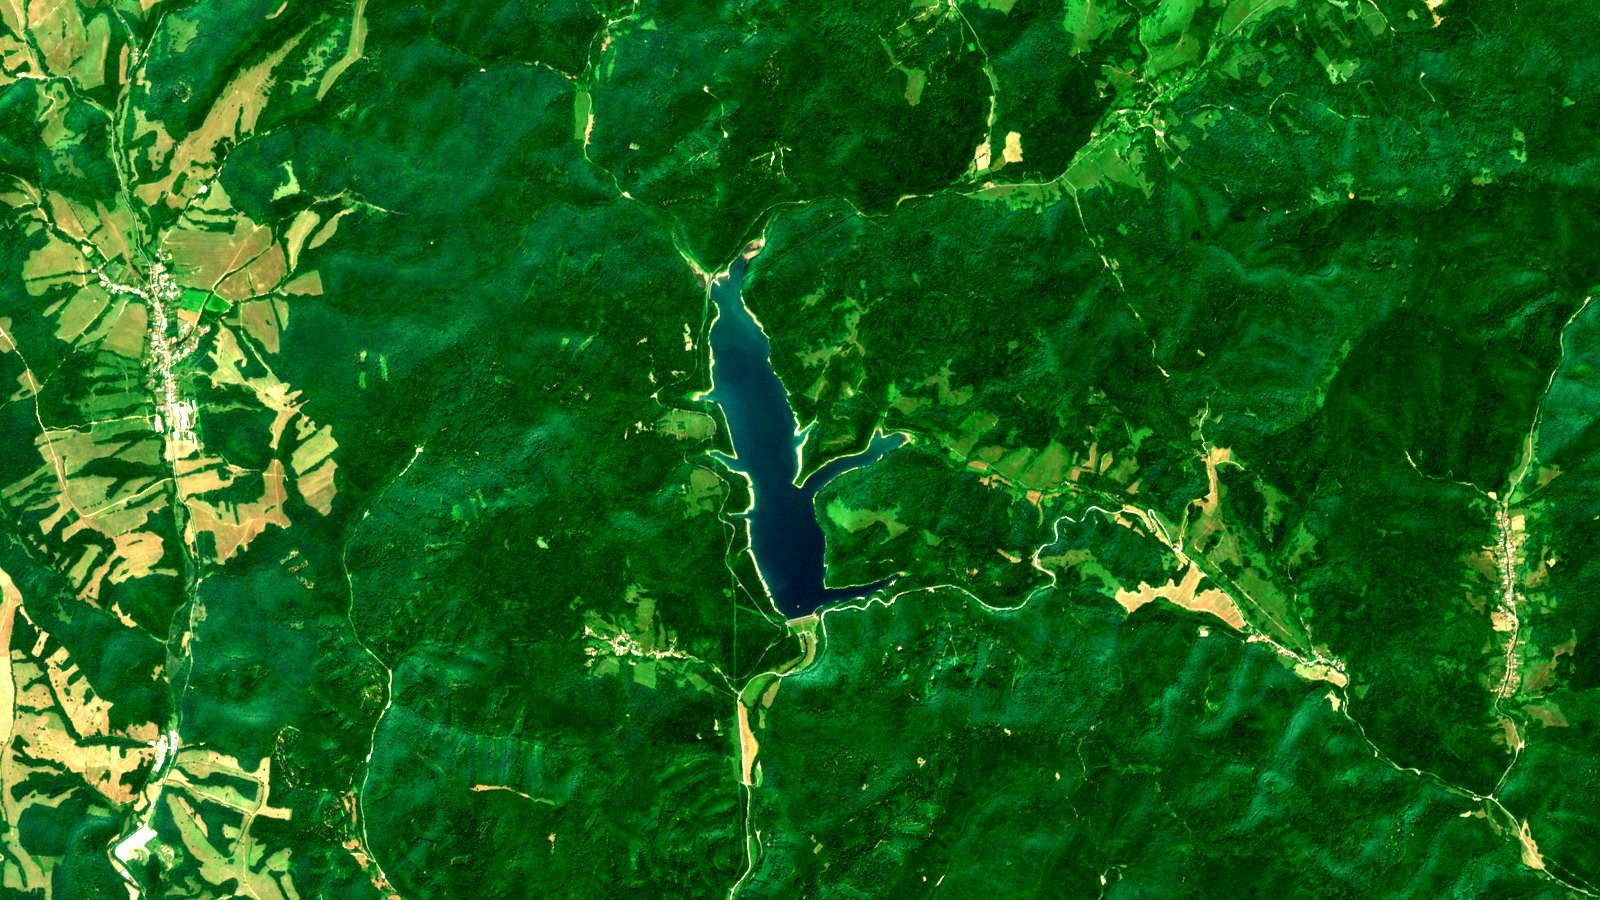
On 12 July 2026, the European Union space programme published its image of the day: a small, branching reservoir in the forests of eastern Slovakia. Its name is Starina. The official page explains why it matters. “Starina Reservoir, in eastern Slovakia, is the country’s largest source of drinking water”, it says. It sits in Poloniny National Park, among primeval beech forests on the UNESCO World Heritage List.
One of the Sentinel-2 satellites took the scene on 29 June 2026, rebuilt by us from the Copernicus Data Space Ecosystem. Look closely and the real question shows up: fine, we have the picture. What do we actually know now?
What our scene shows
True color, bands B04, B03 and B02, across a box 16.1 kilometers wide served at 1600 by 900 pixels: about 10 meters of ground per pixel, the resolution of Sentinel-2’s four 10 m bands. The catalogue reports this shot at 7.1 % cloud; over our box the classification flags none. Hold on to that gap. It comes back.
You can see a long, branching sheet of dark blue water, pressed between steep slopes of thick forest, with the straight line of the dam closing the southern end. And around the water, a continuous pale ring, wider on the western arm.
The official page mentions that ring too. It describes “fields, roads, and pale shorelines tracing the reservoir’s edge”. Then it stops. It does not say the reservoir is low, it does not say Starina is in drought, and it gives no water level.
The trap in the ring: a pale rim does not measure a reservoir’s level
The temptation is obvious: you see a bright rim around the water, like the ring in an empty bathtub, and you decide the level has dropped. But that rim is the drawdown zone, bare ground between the highest water line and today’s, and a reservoir that hands out water through the year, by design, has it just as much when it is working properly. The picture cannot tell a reservoir in trouble from one doing its job. You are missing the before.
Measuring Starina’s water surface in the Sentinel-2 archive
So we went and got it: the water surface for the same late-June fortnight of every year since 2016, over the same box. We asked the data for the water mask instead of guessing it from color: L2A products carry a scene classification band in which class 6 is water, and that is the one we keep. We also keep only the largest patch, the reservoir: counting every water pixel in the box would sweep in rivers and streams. And we drop a shot if more than 5 % of the box sits under cloud or shadow, a limit we set before looking at a single figure. Shadow gets counted on its own: a cloud over water does not dim it, it deletes it, and its shadow steals water pixels without leaving the tell-tale white.
One decision is left, and it nearly cost us this article: we look at every shot in each fortnight, not one.
The catalogue lists, the measurement decides
Every scene in the archive arrives with its cloud percentage already worked out. It is a convenient number, which is what makes it dangerous: it describes the whole scene, not your box. It is the same lesson we learned with Sentinel-2’s fixed pass time over the Guinea-Bissau estuary: the number the catalogue hands you easily is not always the one that answers your question.
We measured this across the 66 dates with a shot. The catalogue figure and ours track each other fairly well, at a correlation of 0.82: close enough to tempt you, not close enough to trust. In 7 of the 11 years, the catalogue’s cleanest shot is not the cleanest one over our box.
The disagreement is not the expensive part. Where it shows up is. On 1 July 2019 the catalogue said 0.7 % cloud, the kind of number that clears any threshold without a second look. Over our box that shot carries 16.2 % cloud and shadow, and it returns 7.0 hectares: the reservoir in shreds, under a cloud the catalogue averaged away against the rest of the scene. The shot we ended up using, three days later, the catalogue rated at 2.9 %, four times dirtier. And it is the good one: 224.4 hectares.
A missing figure gets noticed. A bad one with a stamp on it does not.
Eleven years, five figures
66 dates examined, eleven years, five with a clean shot:
- 04-07-2019: 224.4 hectares
- 25-06-2021: 221.0 hectares
- 30-06-2022: 221.7 hectares
- 01-07-2025: 223.9 hectares
- 29-06-2026: 219.5 hectares
You should know what they are worth. The shoreline runs about 13 kilometers, and being wrong by a single pixel along all of it is 13 hectares: 6 %. That is the floor of the method, and more pixels do not shrink it: errors along a shoreline are not independent, sun angle, wind and turbidity chain them together. Largest to smallest, the five figures differ by 2.2 %: a little over a third of that floor. The five years are indistinguishable.
The six shots the filter threw out also return a number: from 178.4 hectares (2017) to 230.2 (2020), a spread of 29 %, thirteen times the spread of the clean ones. With that deck you can prove Starina is draining or overflowing, depending on the card you pick.
Five late Junes are not a climatology: across the five comparable years, the water sheet measured the same, and we cannot state more. The photo offered a headline in three seconds. The data took 66 dates to report there was none.
What even this does not tell us
We measured surface, not volume. In a reservoir wedged between steep slopes, the level can fall several meters while the sheet of water barely moves. The source itself was careful here: it says Copernicus data serve for “monitoring reservoir water extent, supporting water management and drought response planning”. Extent, not level. It says what it can say, and with five figures, neither can we.
It is no accident that when the European Commission’s Joint Research Centre set out to talk seriously about the planet’s water, it published 32 years of Landsat imagery and called its layers occurrence, change, seasonality, recurrence, transitions and maximum extent. Not one of them fits in a photograph; even the last is a maximum taken across 32 years.
What we build with this
At T3 AISAT we work on that conversion: pixel to data, data to series, series to evidence with a date, a position and a method, the same logic behind our drought early warning work. A reservoir in the Carpathians and one in the Segura basin are measured with the same public infrastructure: the landscape changes, the method does not. And in southeastern Spain, where water is shared out through decisions someone has to defend in front of someone else, knowing what backs a claim is the job.
To redo it: box 22.148 to 22.368 east and 49.017 to 49.098 north, collection sentinel-2-l2a, the fortnight from 22 June to 6 July, SCL class 6, largest connected patch. For each year, every shot is measured and the one with the least contamination over the box is kept (ties go to the earlier date); if that one goes past 5 %, the year is out.
Next time you see a reservoir from space in a headline, pale rim and all, ask the cheap question: compared to what?
Sources: EU Space, Copernicus Image of the Day: Starina Reservoir, 12-07-2026; Sentinel-2 mission page, Copernicus Data Space Ecosystem; and Global Surface Water Explorer, European Commission JRC (Pekel, Cottam, Gorelick and Belward, Nature, 2016). The original image belongs to the European Union, Copernicus Sentinel-2 imagery: we do not reproduce it, you can see it at the source. The scene and the water surface figures are ours.