Spain has burned 206,768 hectares in 2026 across 376 fires, according to the EFFIS statistics portal at 18:00 UTC on 29 July 2026. That is the highest figure in the European Union, and in area it is more than double the twenty year average, which the same portal puts at 95,245.55 hectares per year. The fire that has defined the season started at 13:02 on 22 July in Burgohondo, in the province of Avila.
Divide those two numbers and you get the first hint of what this piece is about: 550 hectares per fire. That is the average size of a Spanish fire in this year’s European statistic. We are not going to repeat the total here. We are going to look at how it is built, and how big the part that falls outside it really is.
The European statistic is anchored at 30 hectares, and it says so itself
The EFFIS statistics portal carries one line under its title that almost nobody quotes: “Fires mapped in EFFIS of approx. 30 ha or larger”. Spain’s 376 fires are fires of that size or bigger. At the foot of that same table there is another warning worth taking with you: “The fires mapped in EFFIS may include fires set intentionally for the purpose of vegetation management”. Neither the European system nor what you are about to read here tells a wildfire apart from an agricultural or land management burn.
The system’s technical page explains where the anchor comes from and how far it reaches. Between 2003 and 2018 the daily mapping used MODIS images with 250 meter pixels and only covered “fires of about 30 ha or larger”. Sentinel-2 was added in 2018, and that changed the reach: “the use of Sentinel-2 imagery allows the detection of fires below the 30 ha threshold and it is estimated that the areas mapped in EFFIS represent about 95% of the total area that burns in the EU every year”. So there is no hard wall at 30 hectares: there is an anchor, and below it the system maps part of what burns. The same page adds the sentence that really matters: “Although only a fraction of the total number of fires is mapped, the area burned by fires mapped in EFFIS represents about 95% of the total area burned in EU”.
The system, then, captures almost every hectare and only part of the fires. And there are two figures that look like they put a number on that missing part, because the EFFIS home page publishes the mapped and the estimated area for the EU as a whole, both running since 1 January. At 18:00 UTC on 29 July 2026 they were 474,211 hectares mapped and 499,169 estimated: a gap of 24,958 hectares, 5.0% of the estimated total, with no perimeter drawn.
It is worth doing that division by hand, because it changes what the number means. 474,211 divided by 0.95 is 499,169.47, and the estimated figure the home page publishes is 499,169. The estimate is not a second measurement: it is the mapped area divided by the same 95% the system declares two paragraphs above. Come back another day, when the page has updated and both figures are different, and the division still works; it also works for the second pair the same home page shows, the one for all of EFFIS coverage and not just the EU. So that gap is not an observation of the ground: it is arithmetic on a constant the system attributes to itself, and whose method is not published on the pages we link. It gives a continental order of magnitude, which is what it is for. What it does not give is where those hectares are or what size they come in.
One warning for anyone who wants to verify this, because the system asks for it. Those two home page figures and the country table in the portal are two different views of the same service, and adding up the table rows by hand does not reproduce the home page total. So we do not mix them in a single operation: the table is used for Spain, the home page for the mapped against estimated pair. The technical page says it outright: “Caution should be taken when comparing this product to other data that may have been produced using different methodologies and scopes”.
That 5% is not spread evenly across the map. Where a fire of tens of thousands of hectares is burning, it is a rounding error. Where there is no such fire, it can be everything that burned. That is what a 20 meter pixel can measure, and that is what we did.
Thirteen days of one district, counted one by one
We picked a box of 46.6 by 44.4 kilometers, about 207,327 hectares, over the Valle del Alberche y Tierra de Pinares, the district of eastern Avila that sits on the north side of the Gredos range. It is the district where the Burgohondo fire started, so the box holds both of the things we want to separate: one huge front, and everything else.
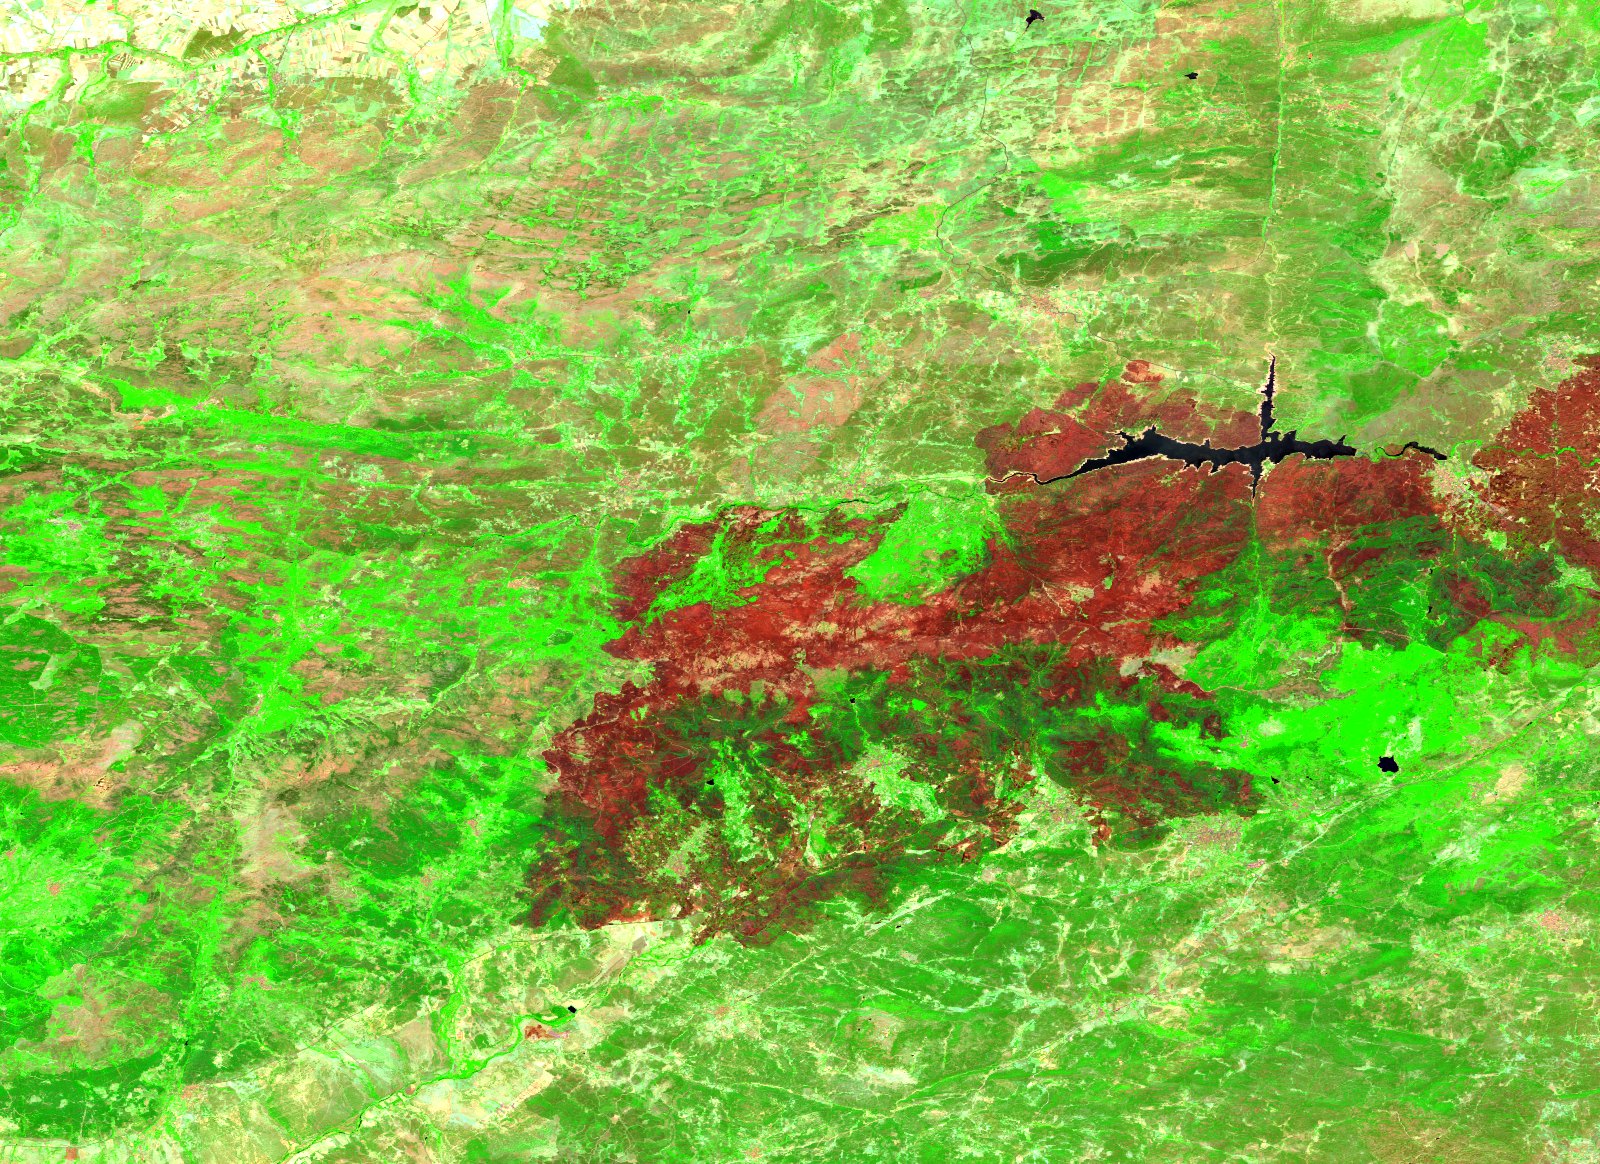
The cover image is our own scene from 29 July 2026, rebuilt from the Copernicus Data Space Ecosystem as a shortwave infrared (SWIR), near infrared (NIR) and red composite. The catalog reports that pass with 0.0% cloud over the box. The scar shows up as a continuous reddish brown patch across the right half of the image, running off the edge of the frame: the front keeps going east, outside our window, so what you see here is part of the fire, not its total.
Thirteen days earlier, same frame and same processing:
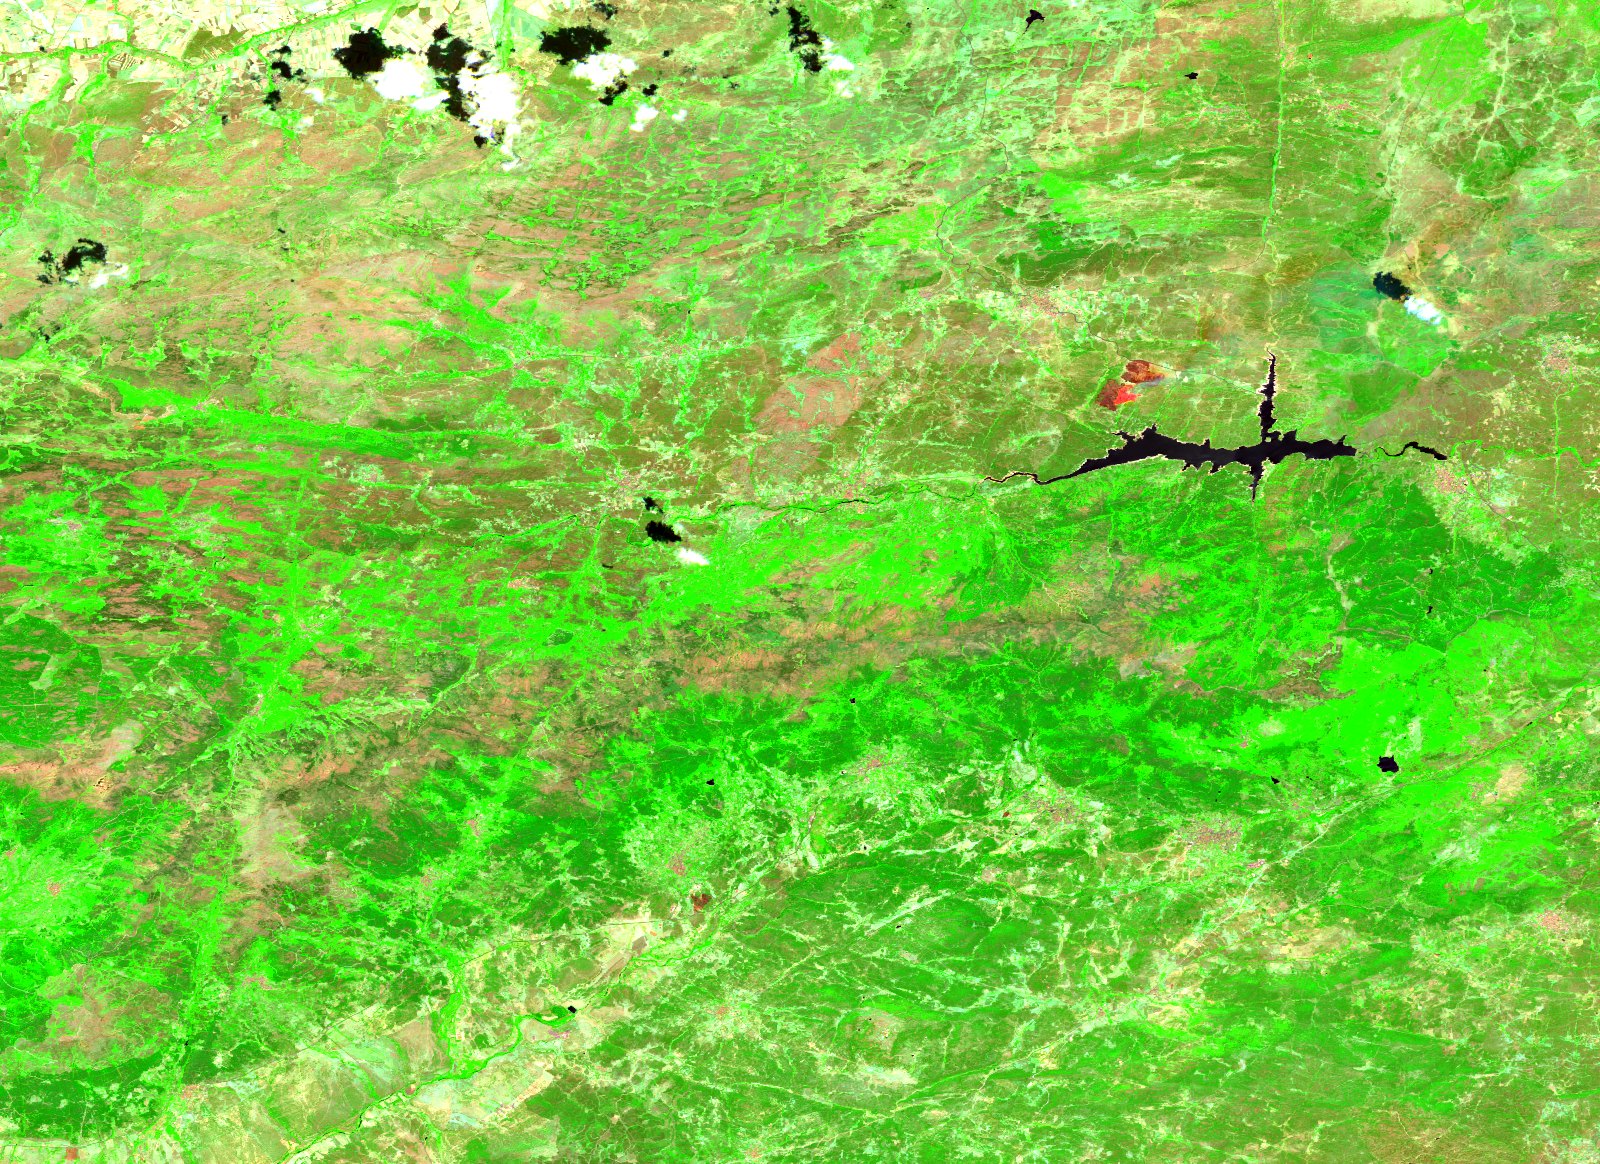
On those two scenes we compute the Normalized Burn Ratio, the same index we used on the Cinco Villas fire and the one the UN-SPIDER recommended practice describes. It is a number between minus one and one that compares those two infrared bands, near infrared (NIR) against shortwave infrared (SWIR): healthy vegetation “shows a very high reflectance in the NIR, and low reflectance in the SWIR portion of the spectrum”, and a freshly burned surface does the opposite. Subtracting the index after the fire from the index before gives dNBR, and “a higher value of dNBR indicates more severe damage”.
There is one important change from that earlier article. Counting one large patch is easy; counting a thousand one hectare patches asks the detector to be right almost every time, because any false positive gets multiplied. So a point on the ground only counts as burned if it meets these three conditions at once:
| Condition | Value | What it rules out |
|---|---|---|
| Index before the fire | above 0.20 | Rock, bare soil and crops already harvested before the first scene |
| Drop in the index | above 0.30 | Small changes in moisture or sun angle |
| Index after the fire | below 0.05 | Harvest and summer drying, which lower the index without crossing it |
The third one does the fine work. The UN-SPIDER guide itself places unburned ground near zero, “non-burnt areas are normally attributed to values close to zero”, while a charred surface goes clearly below. Requiring the point to end up as char, and not just to have dropped, is what separates a fire from a field cut in mid July.
The points are then grouped into connected patches. Before grouping, a cleaning step removes isolated points and one pixel threads, and patches under twelve pixels of 20 meters, that is 0.48 hectares, are dropped. That cleaning is not free and is worth declaring: the index marks 12,808 hectares raw and 11,052 remain after cleaning, 13.7% less. It removes exactly the finest material, which is the class this article is about, so everything you read from here on is a conservative count.
The test that says whether any of this is worth reading
A detector that finds a thousand fires where there are none is worse than no measurement at all. So we put it through the same kind of control we used for low water on the Waal, which is not the same calculation but the same idea: measure the noise floor where the answer is known in advance. Here that means running the whole procedure on two scenes from before the fires, thirteen days apart, where the right answer is zero.
The null test returns 6 patches and 6.4 hectares across the entire box, the largest one 1.7 hectares. Correcting for the cloud on those two dates, which left 67.5% of the box usable, that comes to about 9.5 hectares. Compared in the units that actually matter here, the ones of the small patches: 6 false positives against the 1,229 small patches you are about to read, and 9.5 hectares against their 3,008.
That control has two limits, and a null test sold as stronger than it is helps nobody. First: the two scenes are from 16 and 29 June, and cereal harvest is much more active in the second half of July than in June, so the control does not put the detector under the full pressure of the confuser its third condition was built for. Second: the cloud correction assumes noise is spread evenly, when in reality it concentrates along cloud and shadow edges. With those two caveats, the noise floor still sits three orders of magnitude below what we measured.
1,269 patches, and 1,229 do not reach 30 hectares
Between 16 and 29 July 2026, inside that box, the index marks 11,052 hectares burned, 5.33% of its area, spread across 1,269 separate patches.
Of those 1,269 patches, 40 are 30 hectares or larger and add up to 8,044 hectares. The other 1,229 add up to 3,008 hectares: 96.8% of the patches and 27.2% of the area. The median patch in the district is 1.04 hectares. And 597 patches, nearly half of them, do not reach one hectare.
There is a trap worth defusing before someone else does. A large front leaves unburned islands and narrow necks, and when you group points into patches those necks break: the same fire shows up in pieces, and its fragments slip into the count of small ones. So we separate what sits far from any large patch, with a demanding rule: it is not enough for a patch to poke past the distance, the whole patch has to sit beyond it. Under that rule, more than 250 meters from any patch of 30 hectares or more leaves 755 patches and 1,636 hectares, 14.8% of everything that burned in the district. Beyond 500 meters, 537 patches and 1,135 hectares. Beyond one kilometer, still 236 patches and 479 hectares. The largest of the separated patches is 28.65 hectares, just under the anchor.
Moving the thresholds moves the total, and here are the five sets we tried:
| Index before | Drop | Index after | Total | Patches | Under 30 ha |
|---|---|---|---|---|---|
| 0.20 | 0.27 | 0.10 | 12,251 ha | 1,232 | 2,929 ha (23.9%) |
| 0.20 | 0.30 | 0.05 | 11,052 ha | 1,269 | 3,008 ha (27.2%) |
| 0.20 | 0.35 | 0.00 | 9,764 ha | 1,224 | 2,954 ha (30.3%) |
| 0.25 | 0.30 | 0.05 | 9,204 ha | 1,212 | 2,743 ha (29.8%) |
| 0.15 | 0.30 | 0.05 | 12,962 ha | 1,207 | 2,855 ha (22.0%) |
The published row is the second one. The total moves between 9,204 and 12,962 hectares, and the share sitting under 30 hectares stays between 22.0% and 30.3%. The exact number depends on where you draw the line; the order of magnitude does not.
Those 1,636 hectares come from one district, in thirteen days. This does not say that EFFIS holds none of these patches, since it has also mapped below 30 hectares since 2018. It says where the gap between mapped and estimated area is decided.
Small does not burn the same as large
The same calculation gives severity, which is what decides where crews go first. The ranges proposed by the USGS and adopted by UN-SPIDER split the drop in the index into four bands: low from 0.10 to 0.27, moderate-low from 0.27 to 0.44, moderate-high from 0.44 to 0.66 and high above 0.66.
Before the numbers, two warnings. First, from the method: by requiring a drop above 0.30, the detector rules out the whole low band by construction, and also the first slice of the moderate-low one, so there is no low severity here because there cannot be, and moderate-low comes out short. Second, from the calendar: with the fire still burning on that date, these figures are a snapshot, not a final account.
With that said, in patches of 30 hectares or more the index drops by a median of 0.73 and about 5,060 hectares fall into high severity: nearly two thirds of their area. In the small patches the median is 0.56 and high severity comes to about 950 hectares, a little under a third. These are standard thresholds applied without ground checks, and the guide itself warns that fine interpretation “should also be carried out through field assessment”.
That fits what you would expect: a small fire is usually put out before it consumes everything. But 950 hectares of high severity spread across hundreds of parcels is not a leftover. It is bare soil with no roots holding it, on the north side of a mountain range, two months from the first autumn storms. UN-SPIDER puts it plainly: severity maps “can be used to estimate not only the soil burn severity, but the likelihood of future downstream impacts due to flooding, landslides, and soil erosion”.
And that is the practical difference between the two counts. A fire of thousands of hectares has a single command post, a drawn perimeter and a case file. Seven hundred patches of about a hectare each, spread across a whole district, have none of that, and every one of them comes with its own edge, its own access road and its own slope.
What this measurement is missing, and when it gets fixed
When we took the measurement, on 29 July, the fire was still burning and people had been evacuated from their homes, so it is worth being precise about which part is provisional and which is not.
The provisional part is the large one. Our window clips the main front, which continues east, and on that date the fire was not over: the 8,044 hectares in large patches are a floor, not a total. On top of that, a reliable severity index needs a stable later scene, with the fire out and the smoke gone, and that scene did not exist yet.
The Copernicus Emergency Management Service has rapid mapping activated over the fires in central Spain since 23 July at 09:48 UTC, under activation EMSR900, requested by the national emergency center of Spain’s Ministry of the Interior, and tasked with “initial rough estimation, wildfire extent and damage assessment emergency mapping”. That record describes the fires at Brieva, in Segovia, and at Almorox, in Toledo, spreading to Villa del Prado, in the Madrid region, and it mentions evacuations; its description does not name this district, but one of the three zones the activation maps, “La Atalaya”, does cover it, with the Burguillo reservoir inside and the burned perimeter drawn over it. The official perimeter, the damage assessment and the count of people affected come from activations like that one and from civil protection, not from a satellite image.
What is not provisional is the split by size. We do not claim those small patches are out, because an image cannot show that. We claim they are separated from the front, that their extent is already fixed inside our window between 16 and 29 July, and that the count stands on its null test. Our contribution is the split, not the total.
We will come back to this district in the first week of September, with a stable later scene, to recompute severity and see how many of these small patches are still bare soil when autumn arrives.
What we build with this
Rebuilding a scene and computing an index is not the hard part. The hard part is delivering the whole step, from raw image to a split by size and severity, with the null test done and the procedure written down so it can be repeated next month over another district. That is what we build at T3 AISAT for agriculture, water, climate and emergency response: turning a satellite pass into a number that can carry a budget decision.
A continental statistic is well built for what it was designed to do, which is to measure the European total while leaving a declared 5% of the burned area outside its perimeters. Whoever has to decide where the erosion barriers go next October needs something else: how many patches there are, where they are, and which of them really burned. If no fire with a name reached your district this summer, do you know how many hectares burned in it?