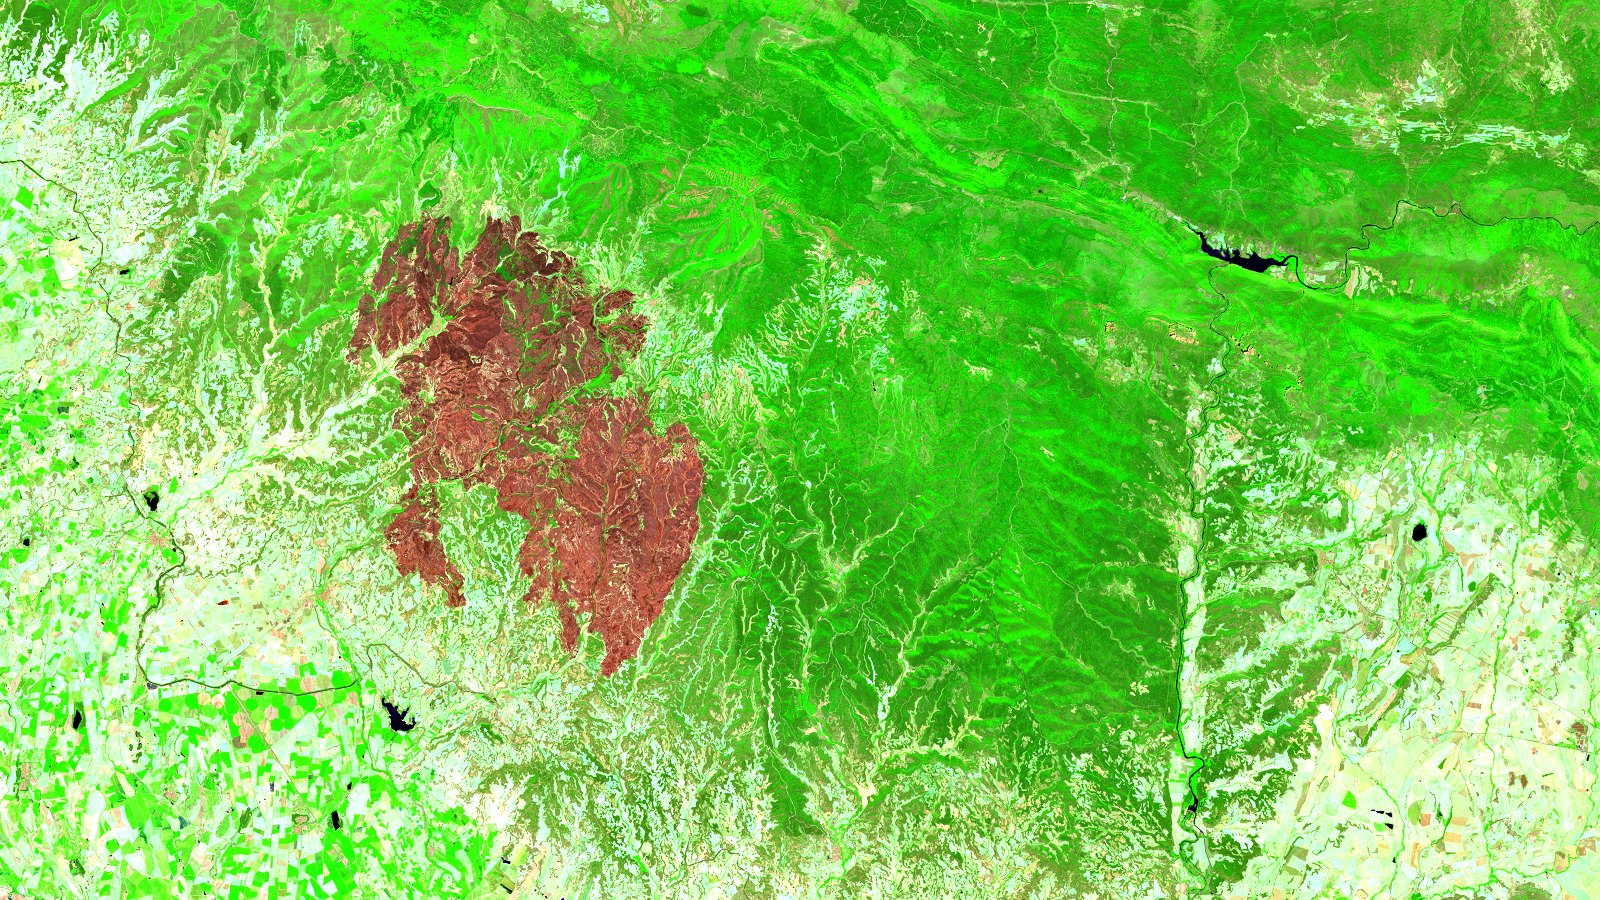
On 15 July 2026, at 13:25 UTC, a wildfire started next to Orés, in the Cinco Villas district of Zaragoza province, Spain. Five days later it was stabilized, with five towns evacuated (Orés, Asín, Malpica de Arba, Luesia and Uncastillo) and about 460 crew on the ground. The regional government of Aragón gave a hard number for the damage: the area actually burned came to 14,400 hectares, along a 78 km perimeter, with 15,700 hectares affected. And here is the telling part: that number came from Sentinel satellite imagery.
That is the part we care about. A 14,400 hectare scar is a figure decided in an office from an image, and that image can be rebuilt and checked. We did it with our own scene and with the same index that emergency services use to measure severity.
In true color, the fire is almost invisible
Our scene is from 23 July 2026, the first clean Sentinel-2 pass over the area after the fire was declared stabilized. We recomposed it from the Copernicus Data Space Ecosystem over a roughly 66 by 36 km regional frame centered on the core of the fire, between Uncastillo, Luesia, Orés, Asín and Malpica de Arba. The catalog returned that date at 0.0% cloud: no cloud and no smoke plume over the scar.
The lead image is a SWIR, NIR and red composite (bands B12, B8A and B04). The scar shows up as a compact reddish-brown patch that is hard to mistake for anything else. Now look at the same scene, the same day and the same frame, with the same corrections, in true color:
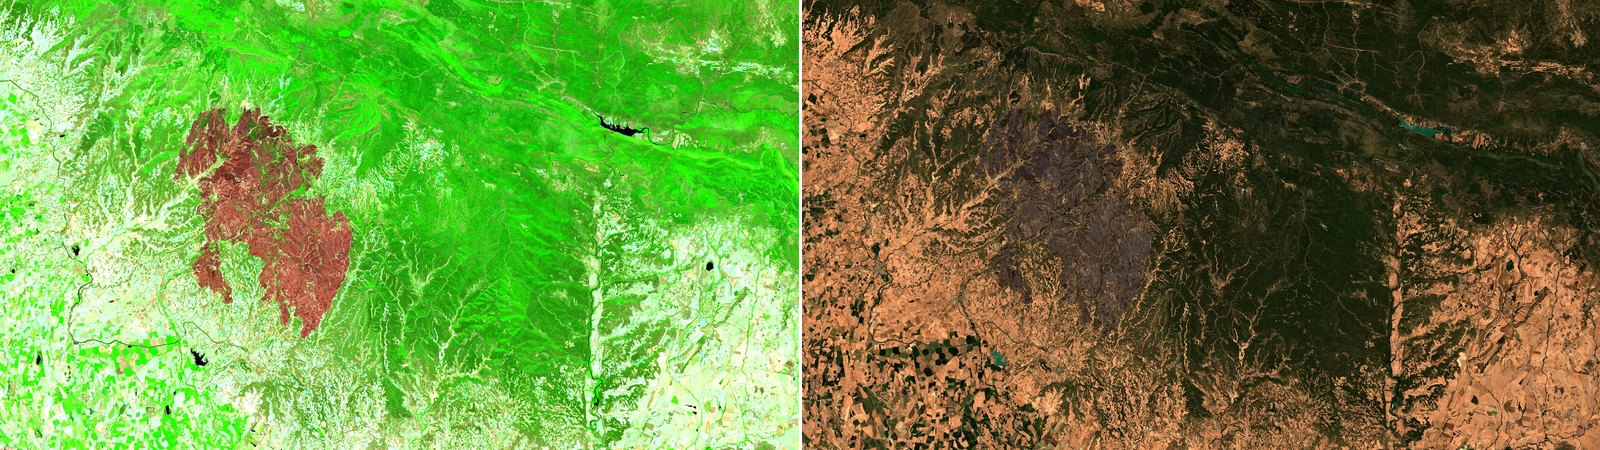
In true color, someone who does not know where it burned could take the scar for dark woodland or a shadow on the slopes. Shortwave infrared removes that doubt, and not by chance.
Why shortwave infrared gives the fire away
The reason is two bands. Healthy vegetation reflects strongly in the near infrared (NIR) and weakly in the shortwave infrared (SWIR); a freshly burned surface does the opposite, low NIR and high SWIR. That is the literal wording of the UN-SPIDER recommended practice: “Healthy vegetation shows a very high reflectance in the NIR, and low reflectance in the SWIR portion of the spectrum … the opposite of what is seen in areas devastated by fire”.
That contrast collapses into one number, the Normalized Burn Ratio, which on Sentinel-2 is built from bands B8A (NIR) and B12 (SWIR): NBR = (B8A - B12) / (B8A + B12). A high NBR is healthy vegetation; a low or negative one is bare or burned ground. To estimate how much a place changed, you subtract the post-fire NBR from the pre-fire NBR to get the dNBR, and “a higher value of dNBR indicates more severe damage, while areas with negative dNBR values may indicate regrowth following a fire”. This is the method taught in the UN-SPIDER step-by-step with Sentinel-2.
How much burned, measured
We computed NBR on two of our own scenes over the same frame: one before the fire (a least-cloud composite of the 20 June to 13 July window) and the 23 July one after it. Over the scar, the index collapses: it goes from +0.36 on average before the fire to -0.18 after, a mean dNBR of +0.54. Over land that did not burn, it does not move: +0.33 before and +0.33 after, a dNBR of 0.00. The index drops exactly where it burned and stays put where it did not. That is the proof it measures the fire and nothing else.
Using the severity ranges proposed by the USGS and adopted by UN-SPIDER, and counting only land that held vegetation before the fire, the split comes out like this:
| Severity (dNBR) | Area | Share of burned (rounded) |
|---|---|---|
| Low (0.10 to 0.27) | 2,427 ha | 19% |
| Moderate-low (0.27 to 0.44) | 2,382 ha | 18% |
| Moderate-high (0.44 to 0.66) | 5,982 ha | 47% |
| High (over 0.66) | 2,000 ha | 16% |
In total the index marks about 12,800 hectares of burned vegetation, of which roughly 10,400 burned at moderate or high severity and about 2,000 at high severity. This is our own estimate, with standard thresholds and no field check, and it sits below the official 14,400 hectares. The gap has a clear reason: we count only land that was vegetated before the fire, we leave out ground that was already bare, and we apply fixed thresholds that are not tuned against field checks. Even so, it lands in the same range as the figure Aragón drew from Sentinel, and from the same satellite. What the index adds to the headline is the breakdown: nearly half of what burned is at moderate-high severity, and about 2,000 hectares burned severely.
The harvested field that looks burned
A number like this needs a careful read. Between late June and 23 July, cereal is harvested across dryland Aragón, and a cut field also loses NBR: to the raw index, it could pass for burned. So we separated land that was vegetated before the fire from land that was not. The filter is not decoration: without it, the index marked about 13,600 hectares at moderate or high severity; once we required that there was something green to burn, that drops to 10,400. Those 3,200 hectares of difference are mostly stubble, not fire. The UN-SPIDER guide warns of the same thing, that water, roads and settlements can slip into the count, and that fine interpretation needs field validation.
What decision this enables
A severity map is not an exercise: it is what decides where you act first once the fire is out. The Copernicus emergency service was activated for this fire (activation EMSR896) with a specific task, “initial rough estimation, wildfire extent, delineation and damage assessment”, covering damage to forest, natural vegetation, buildings and infrastructure. That first perimeter says how much burned; the dNBR says how hard, and that is where decisions change.
Where severity is high, the soil is left bare and without roots to hold it, and that is the part most at risk of washing away with the first autumn storms. UN-SPIDER puts it plainly: severity maps “can be used to estimate not only the soil burn severity, but the likelihood of future downstream impacts due to flooding, landslides, and soil erosion”. For the 2,000 high-severity hectares of Cinco Villas, that means those acres get priority for restoration, brush barriers and runoff control ahead of the rest. And for the graziers of Luesia and the farmers of Castiliscar, some of whom joined the firefighting with their own tractors, knowing which plots burned severely and which barely did is the difference between replanning a season and writing it off.
What we build with this
Recreating the scene and computing the index is not the hard part; the hard part is delivering the full step, from raw image to a per-plot severity map, in a way that reproduces and shows its sources. That is what we set up at T3 AISAT for water, agriculture, environment and emergencies: turning a satellite pass into a figure that can carry a decision, with the procedure written down so it can be run again next month over another fire, another drought or another reservoir, the same approach we used to measure a storm’s height from its shadow over the Veneto. A map no one can rebuild is worth little; one anyone can recompute is worth it as evidence.
The Cinco Villas fire was the second largest in Aragón’s recent history, behind only the 1994 Maestrazgo fire. When the fire is fully out and it is time to decide where recovery starts, do you trust the color of a photo, or the number you can measure again?