By Pedro Hernández
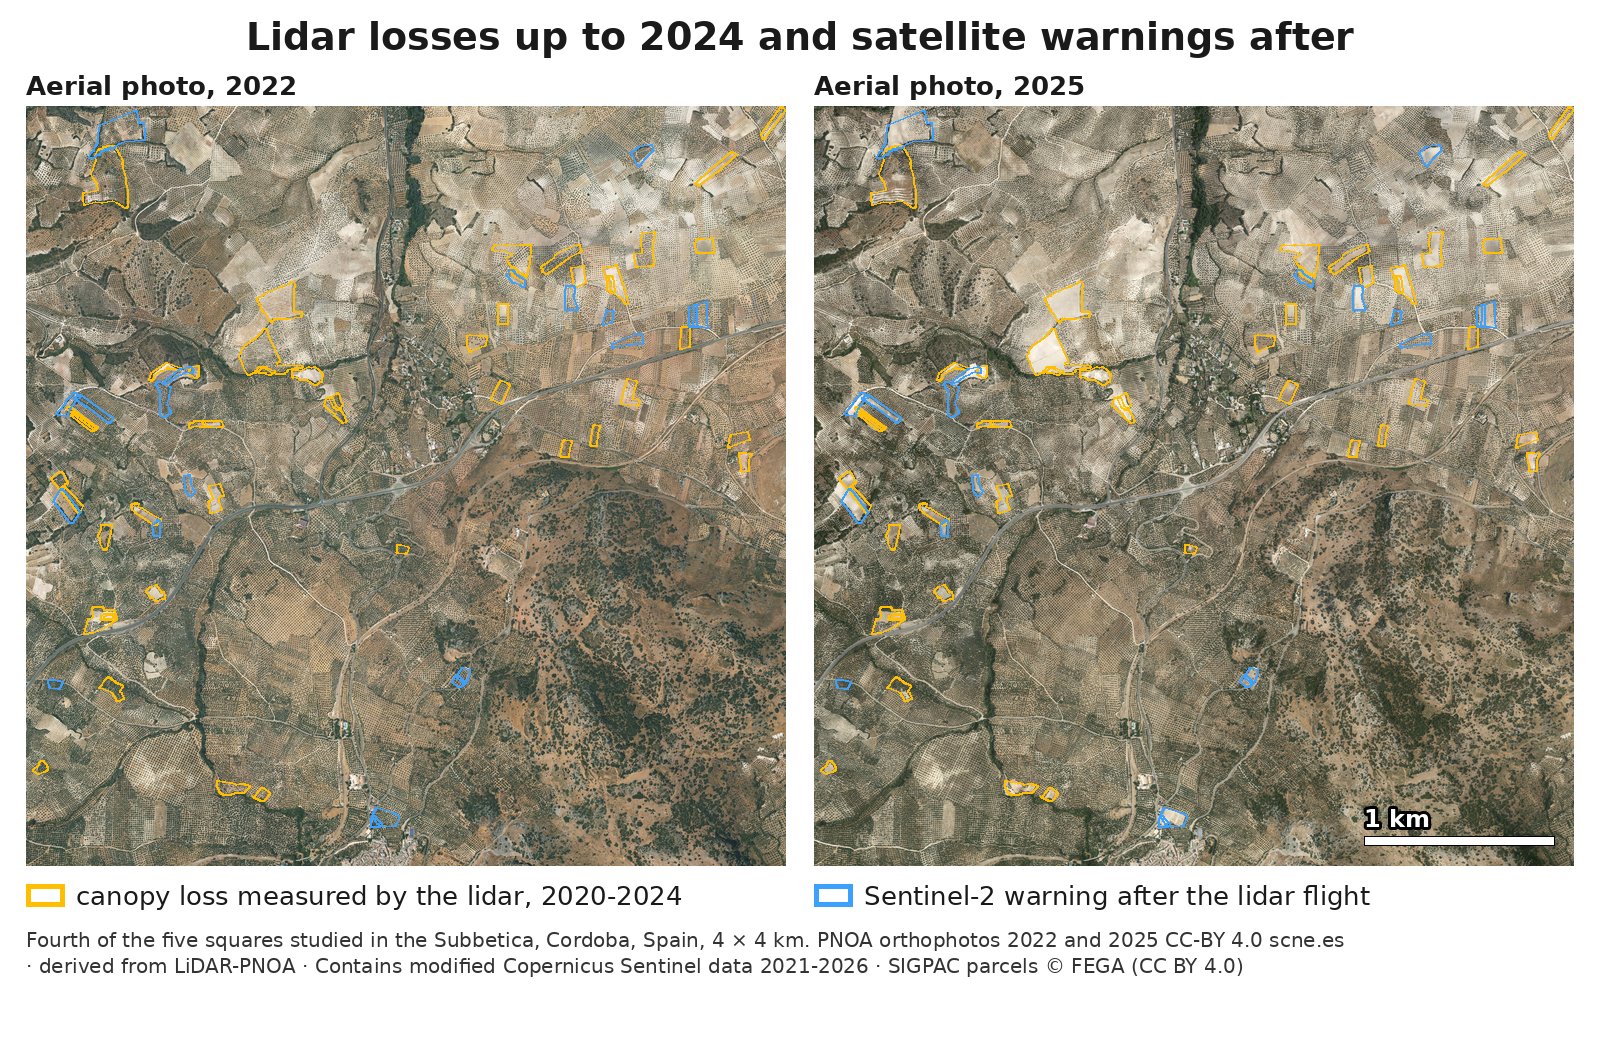
If your cooperative handles applications for the aid for olive groves with specific difficulties, an olive grove that is uprooted and replanted can cost that parcel its aid: in SIGPAC, Spain’s official map of farm plots, it is still an olive grove, but its trees no longer have the average age of more than ten years the aid requires. The laser (lidar) that measures olive trees from a plane sees the uprooted trees, but the PNOA flies it only every few years. We tested this in five areas of 4 by 4 kilometers in and around the Subbetica, in Cordoba, Spain: between one flight and the next, the European Sentinel-2 satellite flagged 66 parcels, the parts of a farm with a single land use in SIGPAC. The 2025 aerial photo could check 44, and 9 in 10 of them are missing olive trees that were there in 2022; among parcels picked at random from those the laser saw with canopy and no loss, only 2 in 100 are. Between the 2020 and 2024 lidar flights, with greenness up to summer 2024, a warning like this one found about 6 in 10 parcels left with almost no canopy. It does not find them all, so it is a list of where to start checking.
Each instrument has its own job. The lidar measures how much canopy there is and how much has been lost, parcel by parcel, in the year it flies. The satellite flags, between one flight and the next, where greenness drops, to decide what to check first: it is a warning, not a measurement. And the aerial photo confirms what happened.
This is the third article about olive groves in the Subbetica. The first one measured the two surface areas of a hillside olive grove, and the second one counted at least 124 olive trees per hectare with the lidar.
What the latest lidar flight shows: 104 parcels lost canopy
The laser is the one flown by the PNOA, Spain’s National Aerial Orthophotography Plan: a lidar on a plane that sends out pulses of light and measures how high they bounce back, so it draws every tree crown with its height. We compared its flights of September or October 2020 and May 2024 over 8,857 olive parcels. In 104, adding up to 79.5 hectares, canopy cover, the share of the ground covered by tree crowns, fell by 10 points or more: these are what we call lidar losses. In 64, almost no canopy was left: these are what we call emptied parcels.
Why dates from 2020 and 2024 in 2026? Because they are the two latest PNOA lidar flights over these areas: the PNOA covers Spain with lidar in surveys that take several years, and the third one runs from 2022 to 2025. And because what was uprooted then still counts today: an olive grove replanted in 2023 will not have an average age of more than ten years until 2034. What has happened since the latest flight is told by the satellite, up to summer 2026, and by the 2025 aerial photo.
The aerial photo confirms it. We read the PNOA photos of 2019, 2022 and 2025 for 285 parcels with a computer vision model, without it knowing which parcel each image showed or which ones the lidar or the satellite had flagged. It agrees with the lidar in 97% of the lidar losses and random parcels that could be read. It sees olive trees removed in 99 of the 103 lidar losses, and no change from 2019 to 2025 in 97 of 100 parcels picked at random. A person on our team also checked every image by eye. In the 25 where the person and the model disagreed, a second computer vision model read them again: it sided with the first in 20. The person looked again at the unclear ones and sided with it in one more. In the 64 emptied parcels, the model sees olive trees removed in all of them. Of the 23 lidar losses that were read again, 2 are heavy pruning, not uprooting, and pruning does not change the age of the trees.
In 42 of the 64 emptied parcels, the 2025 photo already shows young trees planted in rows. If it is replanted with olive trees, the parcel is still an olive grove in SIGPAC; what changes is the age of its trees.

After the 2024 flight: 9 in 10 of the satellite warnings the aerial photo could check have olive trees missing
After the May 2024 flight, no newer PNOA lidar flight of these areas has been published, according to the status of its third national survey. What we do have is the satellite and the 2025 PNOA aerial photo, which we used in its provisional version; the final one, with 15-centimeter detail, is scheduled for late 2026, according to the timetable in the agreement published in Spain’s Official State Gazette.
Sentinel-2 is a series of European satellites that passes over every few days. It measures greenness with the NDVI index, which rises with living vegetation. Its 10-meter pixel cannot pick out a single olive tree, but it sees a parcel’s greenness drop when its crowns are removed.
The warning flags the parcels the 2024 lidar saw with canopy and whose summer greenness has dropped since 2021 much more than that of the rest of their area. That is 66 parcels and 55.8 hectares. The list and how we would check it were written down before we looked at the 2025 photo, according to our internal log, and sealed that same day with OpenTimestamps, a public timestamping service.
The 2025 photo can only check the warning in the 44 parcels whose greenness was already dropping that summer; the sealed plan had already set them apart before we looked at the photo. In 39, olive trees are missing, 9 in 10, and in 26 almost all of them are gone. Parcel 2 in the figure, 13.7 hectares, is one of them: the May 2024 flight still saw it with canopy, Sentinel-2 sees its greenness drop from summer 2024, and the 2025 photo shows it mostly uprooted.
In the other 22, greenness starts dropping in 2026, after the photo; the next photo or the next flight will tell. Counting all 66, olive trees are missing in 41. Put another way: of 66 parcels chosen with the list for checking, the photo shows olive trees removed in 41. Picked at random among those the lidar saw with canopy and no loss, 66 would give one or two, and up to five within the sample’s margin.
Before the 2024 flight, 25 of the 40 parcels the satellite ranked first had already lost canopy
The same greenness drop, from 2021 to 2023, already ranked the parcels before the May 2024 flight. We set it in the first area and tested it blind in the other four, with the same test for every method: how many parcels with lidar-measured canopy loss each one puts among its top 10 in each area.
| How parcels are ranked, with data from before the 2024 flight | Parcels with lidar-measured canopy loss among the top 10 in each area (40 in all) |
|---|---|
| Summer greenness drop, our rule | 25 |
| Copernicus European canopy density map, 2021 to 2023 | 17 |
| BFAST Monitor, a published change detection method, with its default settings | 14 |
Picking 10 parcels at random in each area would give, on average, less than one with a loss: only 1 in 84 parcels in those four areas lost canopy. That is why 25 is not luck.
Among the published methods for detecting change in satellite time series, we tested a widely used one, BFAST Monitor, with the default settings of its published package. It could do better with other settings.
The European canopy density map, from the Copernicus land monitoring service, has 10-meter pixels and comes out once a year. With 40 places in four areas, the difference from our rule is not enough to say one is better. The clear difference is timing: its 2024 map was published in July 2026, according to its entry in the Copernicus catalog, a year and a half after the end of 2024, while a summer’s greenness can be checked as soon as that summer ends.
What the satellite list does not see
With the lidar as the reference, a rule like the warning, with greenness up to summer 2024, found about 6 in 10 parcels left with almost no canopy between the two flights. And among the parcels picked at random outside the list, 2 in 100 have olive trees removed. That is only two cases, but across the thousands of parcels outside the list they can add up to more than the list itself.
The list says where to start. To see everything, parcel by parcel, you need the next lidar flight, or a check of the whole aerial photo each time the PNOA publishes it.
What it means for a cooperative
Above all, it matters for the aid for olive groves with specific difficulties. According to Article 79 of Royal Decree 1048/2022, among other conditions it requires rainfed olive groves with an average plantation age of more than ten years and at least 30 trees per hectare, and no more than 100 unless the slope is 25% or more. For 2025 applications, it paid 51.51 euros per hectare on the mainland, in its first tier, according to the Spanish Agricultural Guarantee Fund (FEGA).
A parcel that was uprooted and replanted does not meet the age condition until its trees are more than ten years old. If only some olive trees are missing and they are replaced, the average age can stay above it; that is why the list says where to check the age, not whether it is met. Since 2023, according to FEGA, the authorities check every area-based aid application with the Sentinel satellites. A replanted olive grove is still an olive grove, so a check that only looks at land use cannot tell it from a mature one; what changes is its age. With the list, the cooperative knows which parcels to check first before the 2027 application. Declaring a parcel that does not qualify has consequences: that area is not paid, and if what is not accepted exceeds 3% or two hectares of the declared area, the aid is cut by twice the percentage not accepted, and above 20% it is lost entirely, according to Article 18 of Royal Decree 147/2023.
Trees per hectare and slope can be checked from the air, and rainfed status in SIGPAC. In the first area, 511 rainfed olive parcels have a slope of 25% or more according to SIGPAC and at least 30 crowns per hectare according to the lidar, which counts each tree by its crown. Another 91 rainfed parcels, on gentler slopes, come out with 30 to 100 crowns per hectare, and they add up to 53 hectares. Of those 91, the 37 with 92 to 100 crowns per hectare are worth visiting first: in the second article the lidar missed up to 8% of the olive trees where crowns do not touch; if they do not touch here either, with that error they could go over 100 trees.
The right instrument for each question
| Question | PNOA lidar | Sentinel-2 satellite | PNOA aerial photo |
|---|---|---|---|
| How much canopy is there, and how much has been lost? | Measures it, parcel by parcel, in the year it flies | Does not measure it: from one year to another, its estimate was off by about 10 points, as much as the loss we look for | We did not measure it with the aerial photo |
| Where are olive trees being uprooted now? | Does not see it: there are years between flights | As a warning: olive trees missing in 9 in 10 of the 44 the 2025 photo could check, and in 41 of all 66 flagged; it does not see everything | Confirms it, in the year the photo is flown |
| Has it been replanted? | Only once the new trees are taller than 1.2 meters, the height from which we count canopy | Not tested | Yes: 42 of the 64 emptied parcels already have young trees in rows |
What we offer
Wherever there is a PNOA lidar flight, we prepare the list of parcels worth visiting for the olive grove aid, as part of our work in the agrifood sector. We count the crowns with the latest lidar flight and match them with the official SIGPAC slope. We deliver a table with each parcel’s SIGPAC reference, crowns per hectare, slope and visit priority, and the same list as a layer to open in mapping software (GIS).
Between one lidar flight and the next, we also provide a Sentinel-2 warning of the parcels whose summer greenness drops, to decide which ones to visit first: it is a warning, not a measurement, and it has only been checked with one pair of flights, those of 2020 and 2024, and with the 2025 photo, in these five areas. It is ranked by the size of the drop. If you need data more recent than the last PNOA flight, we can process a drone lidar flight over the flagged parcels.
We only need the area or the list of parcels. We can start with a test area of your choice and, with you in the field, check a sample of the first list we deliver. Write to us.
The limits of these results
- It is a warning, not a measurement. The lidar measures canopy loss; the warning says which parcels to check first, and the aerial photo or the next flight confirms it.
- It does not see everything. A rule like the warning, with greenness up to summer 2024, found about 6 in 10 emptied parcels between the two flights. That is why the list says where to start, not where everything is.
- Checked against the aerial photo, not in the field. In five areas in and around the Subbetica. We propose checking it with you in the field, on a sample of your first list.
In which of your parcels have olive trees been uprooted since the last lidar flight, and which ones could qualify for the olive grove aid?
Data: Contains modified Copernicus Sentinel data 2017-2026; derived from LiDAR-PNOA-cob2 and cob3 and from MDT50cm-cob3 CC-BY 4.0 scne.es; PNOA orthophotos 2019, 2022 and 2025 CC-BY 4.0 scne.es; Copernicus Land Monitoring Service, High Resolution Layer Tree Cover Density; SIGPAC parcels © FEGA (CC BY 4.0) and SIGPAC of the Junta de Andalucia, for the years 2020 to 2025.
How it was done. The figures are our own calculations on the official data cited, and the references were checked against their sources.