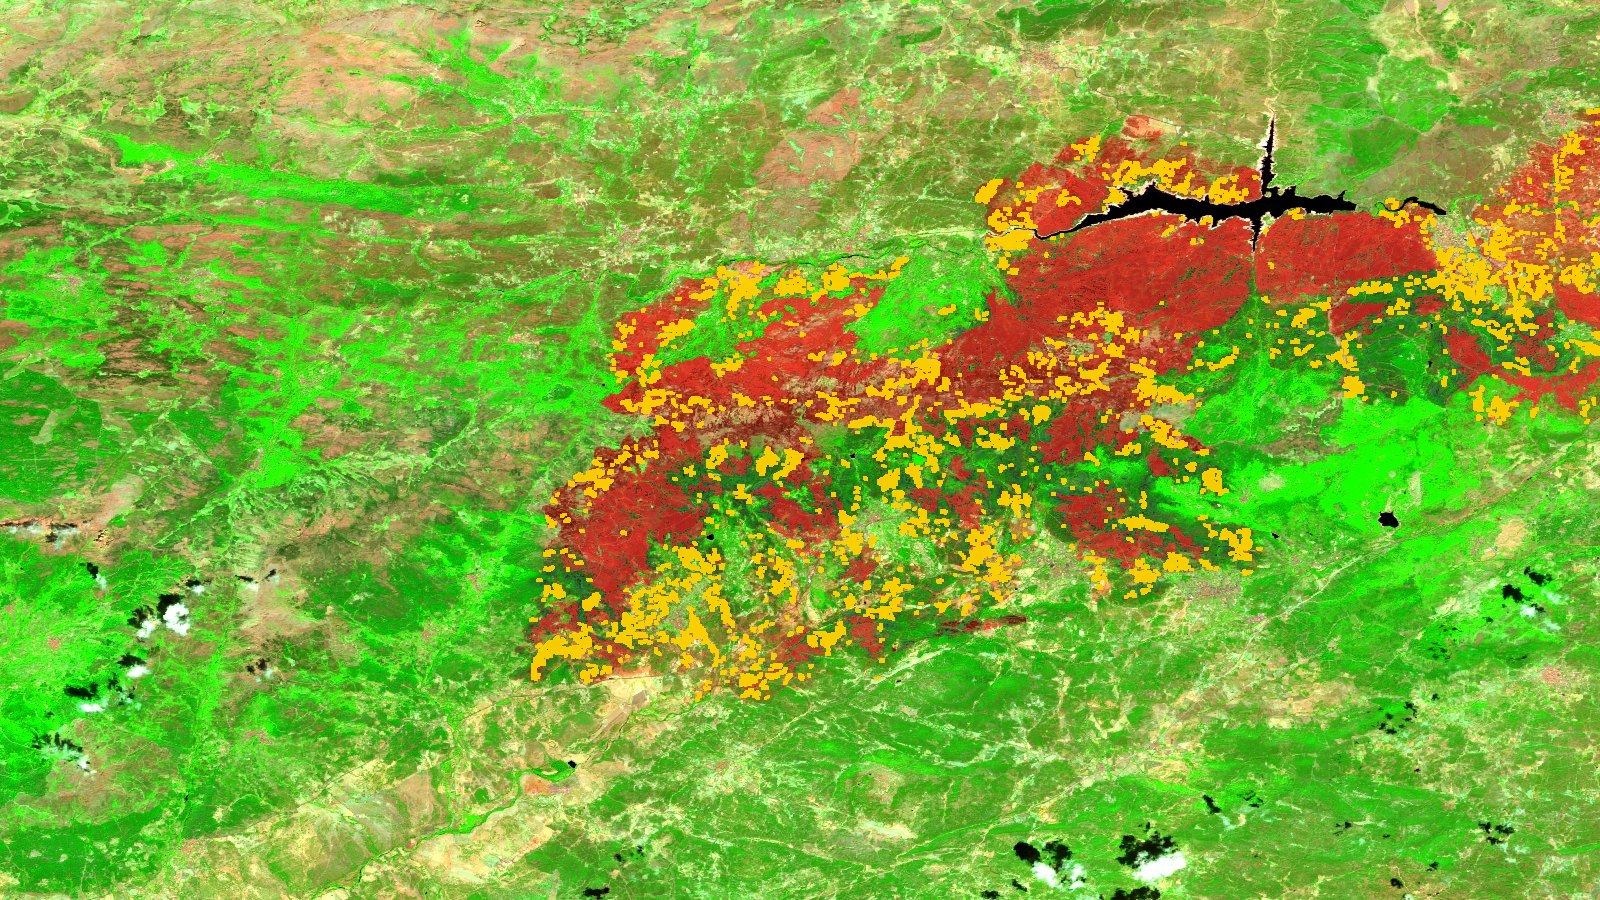
On 30 July we published a measurement of what burned in thirteen days in one district of Avila: 11,052 hectares in 1,269 patches, 1,229 of them under 30 hectares. That piece left two things provisional, because the fire was still active on the day of the scene: the severity, measured with the front still live, and the tally of the large patches, which ran out of the frame to the east. And it promised to come back in the first week of September with a stable later scene, to recompute severity and see how many of the small patches were still bare soil.
This is that return. The scene is from 28 August 2026, thirty days later. By then the Burgohondo fire, declared on 22 July, had been given as controlled since 16 August, though not as extinguished. The answer to the question we left open fits in one sentence: of the 1,229 small patches, 1,176 are still mostly charcoal. Not one has recovered green over half its area.
One caveat that applies to every figure below. Between the pre-fire scene and the one from 28 August there is valid data over 97.86 percent of the frame. The remaining 2.14 percent is 4,437 hectares that the Sentinel-2 scene classification discarded as cloud, cloud shadow, cirrus, snow or saturation on one of the two dates, and over which we measure nothing. What is not measured can only add burned area, never subtract it: everything that follows is a conservative count.
The same measurement first
Before measuring anything new, we reran July’s measurement with the same detector, the same two scenes and the same thresholds, to check that the method still gives the same result. The pixel is 20 meters on a side, that is 0.04 hectares, and the detector drops patches smaller than twelve pixels, which is 0.48 hectares. That is the scale of everything that follows.
It gives exactly the same result: 1,269 patches and 11,052.0 hectares. Of those, 40 patches reach 30 hectares or more and add up to 8,043.9 hectares; the other 1,229 stay below and add up to 3,008.1. Had that reproduction failed, nothing that follows would be comparable, so if it does not match, we do not go on.
This time we also saved something July did not: the geometry of every patch. How large each one is, where its center sits, and which part of the frame it covers. That is what makes it possible to paint them on the cover scene, and it is what July lacked to do so.
Severity, now measured on a stable scene
Two numbers are in play here, and it is worth separating them from the start, because they move in opposite directions. The NBR, Normalized Burn Ratio, is computed on a single scene by comparing near infrared and shortwave infrared: it falls when vegetation disappears, and charcoal leaves it negative. The dNBR is the NBR before minus the NBR after: it rises when the ground has got worse. An NBR going up and a dNBR going up say opposite things, and in this article we always name which of the two we mean.
Severity is measured with the dNBR, which is July’s index and UN-SPIDER’s recommended practice. The classes are the USGS ones that guide adopts: low from 0.10 to 0.27, moderate-low from 0.27 to 0.44, moderate-high from 0.44 to 0.66 and high from 0.66 to 1.30. Anything above 1.30 falls outside the USGS table; we count it in the high class as well, and it comes to 69.5 hectares out of the 6,239, or 1.1 percent.
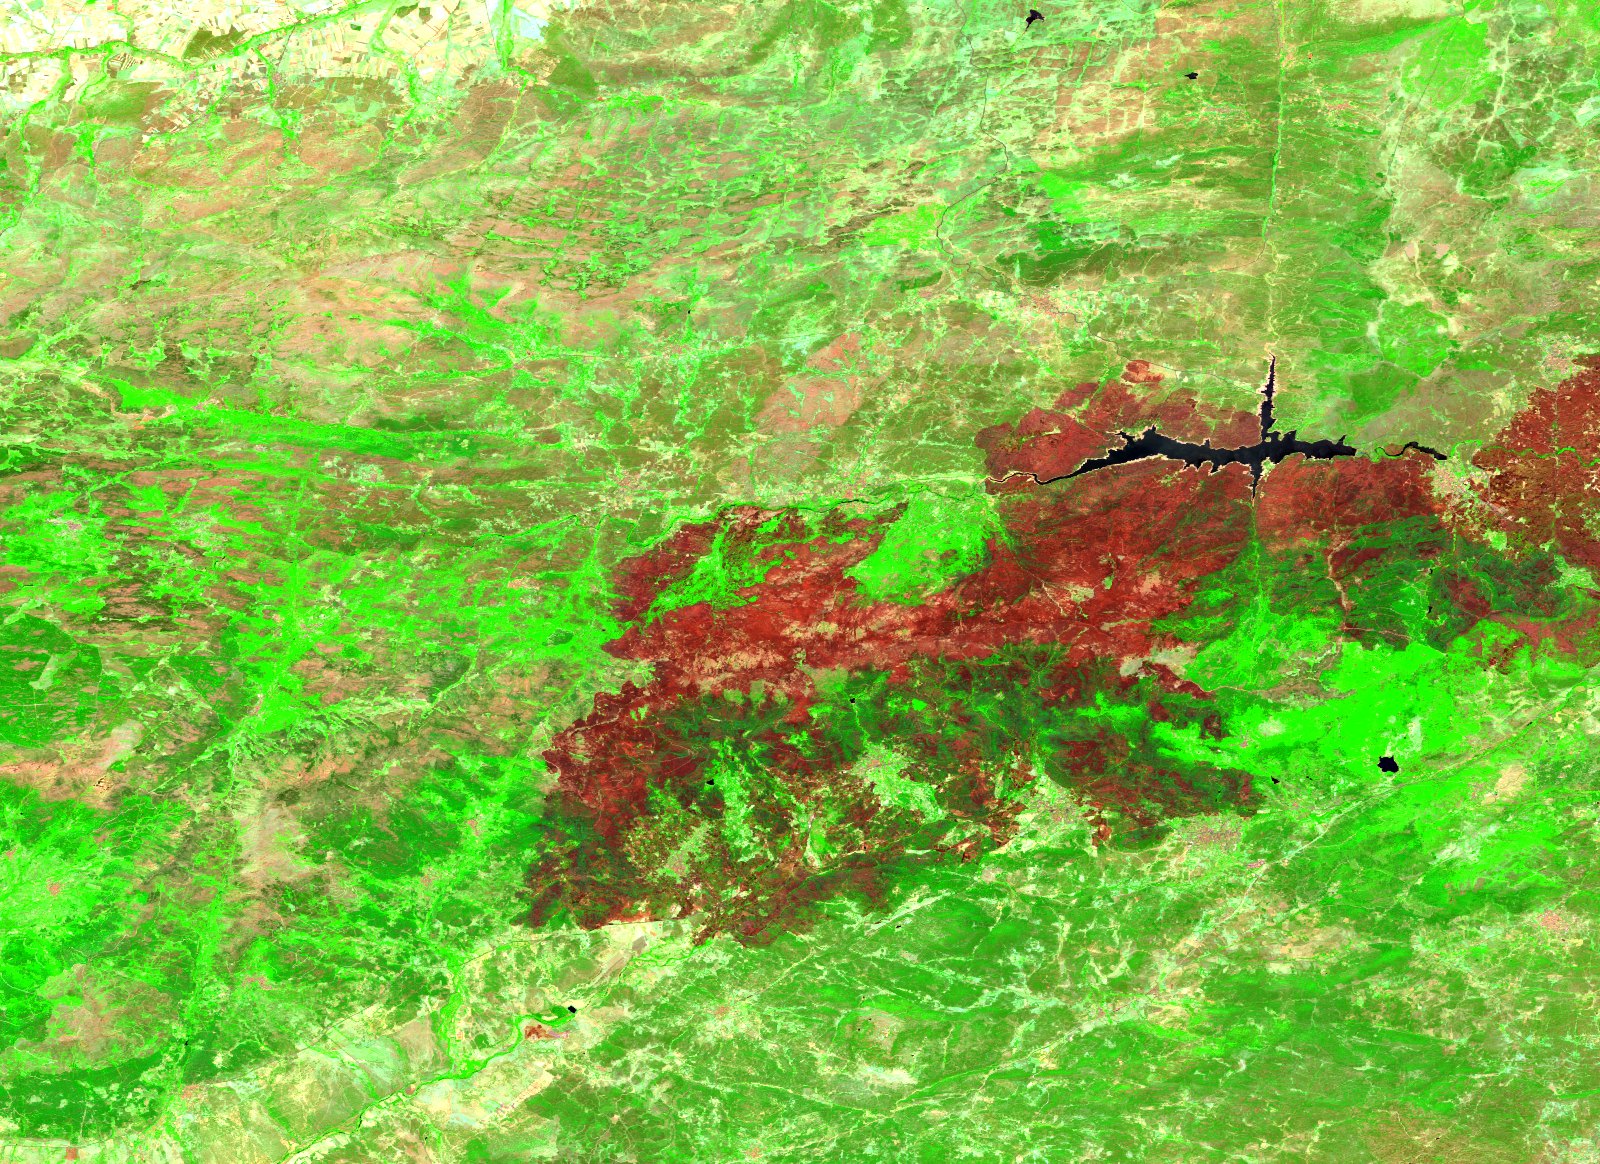
What changes is the later scene. In July it was the one from the 29th, with the fire still burning in the district. Now it is 28 August, and the comparison is the one a severity index asks for: two clean scenes, one before and one well after.
| July scene (fire active) | 28-08 scene (stable) | |
|---|---|---|
| Median dNBR, patches of 30 ha or more | 0.73 | 0.755 |
| Median dNBR, patches under 30 ha | 0.561 | 0.578 |
| High severity in the large patches | 5,058 ha | 5,133 ha |
| High severity in the small patches | 947 ha | 1,106 ha |
| High severity in total | 6,005 ha | 6,239 ha |
Measured against the stable scene, severity does not drop: it comes out the same or slightly higher. The median rises by two and a half hundredths in the large patches and by a little under two in the small ones, and the area in high severity grows by 4 percent, from 6,005 to 6,239 hectares. The large patches go from 5,058 to 5,133 and the small ones from 947 to 1,106, so two thirds of the increase is in the small patches.
That difference is small, and we cannot say what caused it. To separate out the effect of the fire still burning on 29 July, we would need a control we have not measured: the same calculation over unburned ground in the frame, between the same two dates. Without it, the rise is consistent with the live front, and equally with the drift you get over thirty days, which is a month more of drought on the vegetation that survived and a lower sun in late August than in late July. And one detail does not quite fit the easy explanation: if what moved July’s measurement were the patches still burning, the median of the small ones should have risen more than the median of the large ones, and it rises less. What the comparison does establish is the direction: if July was wrong, it was low, not high.
The split we reported in July holds: large patches burn more severely than small ones, 0.755 against 0.578 median, and in the large patches almost two thirds of the area is in high severity. But the 1,106 hectares of high severity spread over small patches are not a leftover either, and they are no longer a half-taken photograph.
Something appears that could not appear in July: 145 hectares inside the burned area whose August dNBR falls in the low class, between 0.10 and 0.27. July’s detector required a drop greater than 0.30, so by construction nothing could land there. That 145 hectares now fall in that class means their NBR has risen and pulled the difference towards zero: on 1.3 percent of the burned area the ground has recovered part of the way.
This is not the only sign of recovery in this scene, nor the largest. It is the strictest, because it requires the dNBR to fall below 0.27. The next section looks at the same recovery with another criterion, the NBR charcoal threshold, and counts about 870 hectares that have already crossed it: 8.6 percent of the 3,008 small hectares plus 7.6 percent of the 8,044 large ones, six times these 145.
Bare soil: the literal question
What we asked in July was how many small patches would still be bare soil by autumn. Autumn has not arrived, but thirty days is enough for the first answer to show.
We measured, pixel by pixel, the NBR on 28 August inside each July patch. There is no subtraction and no severity here: it is the value of a single scene, and it rises when vegetation comes back. An NBR below 0.05 is charcoal or uncovered soil, the same threshold the detector uses to decide a surface is burned. An NBR above 0.20 is a vegetation signal, the same threshold the detector uses to decide there was something to burn before the fire. In between, transition.
In the small patches, 91.5 percent of pixels are still below 0.05. 8.1 percent are in transition. 0.5 percent are back above 0.20. The median NBR is −0.21, which is charcoal. The three classes are exclusive and leave nothing out; they add to 100.1 because all three are rounded to one decimal.
In the large ones, much the same: 92.4 percent charcoal, 7.0 percent transition, 0.6 percent vegetation. Median −0.34.
Counted by patch rather than by pixel: of the 1,229 small ones, 1,176 have more than half their area in charcoal, 95.7 percent. In 908 of them, three in four, charcoal covers 90 percent or more. And not one, not a single one, has more than half its area with vegetation back.
July’s article wrote that a small fire usually goes out before consuming everything, and it headed off the reassuring reading that invites: those hectares of high severity spread over hundreds of parcels, it said, were not a leftover. Thirty days on, the measurement proves it right by the shortest route. In severity at the time of burning, the small patches burned less: 0.578 against 0.755. In the state of the soil thirty days later, there is no advantage: 91.5 percent of pixels in charcoal against 92.4 percent in the large ones.
What burned after 29 July
The 28 August scene also allows what July could not: looking at what appeared afterwards. We ran the same detector between the pre-fire scene and 28 August, and kept what is burned now and was not on 29 July.
That is 276 new patches and 270 hectares. None reaches 30 hectares: the largest is 16.2 and the median 0.64. The big front did not grow inside our frame, because it had already left it to the east by 29 July.
And they are not, for the most part, the edge of the front finishing burning. Only 32 of the 276, with 24 hectares, lie within 100 meters of any large July patch; 220, with 231 hectares, are more than 250 meters from any of them, and 110 more than a kilometer away. The remaining 24 fall in between. That is about nine new patches a day for a month, all below the size the European statistics work with.
Before anyone reads more into that than is there: the fire was not out, and some of those patches may be its own. The regional government of Castilla y Leon gave it as stabilized on 6 August and as controlled on the 16th, twenty-five days after it was declared, according to Tribuna de Avila. And days earlier, hot spots had appeared in “areas such as La Vereda, in the municipality of Piedralaves; La Adrada, or the El Horcajo dam”, our translation of the Spanish, and the authorities were investigating them as possible deliberate reignitions, that is, fire set on purpose inside ground that had already burned. Infobae reports it in a piece dated Thursday 6 August, which places those hot spots “on Monday”: the date, 3 August, is ours. On top of that comes what we warned about in July: neither the European statistics nor this detector tells a wildfire apart from an agricultural or management burn, and the false-positive control we published then was run over a thirteen-day gap, not over the forty-three days that separate these two scenes. So 276 is how many new patches appear burned, not how many new fires there were.
The tally, and what the tally cannot say
Adding July and what appears burned afterwards, 11,569 hectares burned in the frame between 16 July and 28 August: 5.58 percent of its 207,327 hectares. It is the tally we could not give in July and can now. That percentage divides a numerator measured over 97.86 percent of the frame by the whole frame, so it is a floor: the real figure cannot be lower, and over the 4,437 hectares with no data we do not know what burned. The sum is not 11,052 plus 270, and it is worth saying why: newly burned ground comes to 517 hectares, and only 270 of those group into patches above the 0.48 hectare minimum. The rest counts in the tally and not in the patch count. Both terms come out of the detector with the same cleaning applied, so they are measured with the same yardstick. And the 11,052 was already a conservative count: in July the index marked 12,808 hectares raw, and that cleaning, which removes isolated points, one pixel threads and patches below the minimum, took 13.7 percent off. With the same limit as before: the main front left the frame to the east, so this is the district’s tally, not the fire’s. According to Tribuna de Avila that fire burned more than 50,000 hectares and is the largest on record in the country’s recent history; our 11,569 hectares are not a slice you can subtract from or divide into that figure: they are measured with a different method, inside a different boundary, and they also count ground the named fire does not explain.
There is a second limit, and it belongs to the method, and it is worth telling because it is instructive. Had we, instead of adding July and August, run the detector only between the pre-fire scene and 28 August, as if July did not exist, it would have given 10,225 hectares: 827 fewer than July alone, and 1,344 hectares that July detected it would no longer see. Not because they did not burn. Across those 1,344 hectares the median NBR now sits at 0.07, and on 64.6 percent of them the NBR has already crossed the charcoal threshold, so the detector, which requires charcoal, discards them. The remaining third is still charcoal and drops out for other reasons of the detector itself: either the dNBR no longer reaches the minimum drop it demands, or the patch has frayed and its pieces fall below the minimum size.
What has raised the NBR there, we do not know. The band between 0.05 and 0.20 is exactly the one we call transition here, and it has room for both ash carried off by rain and an early regrowth that has not yet reached a vegetation signal. Telling them apart needs one more scene, and for the ash a rainfall figure for the period that we have not measured.
The lesson is simple: a detector designed to count small patches without false positives is, for the same reason, bad at late tallies. Here, a month of delay costs it 1,344 hectares. That is why we build the tally by adding two measurements close to the fire, and not with one distant measurement.
What this means for October
Of the 3,008 hectares of small patches July measured, 91.5 percent were still below the charcoal threshold on 28 August: soil with no vegetation cover thirty days on. They are spread across 1,229 sites, and almost half of those measure less than a hectare. After 29 July another 276 appeared.
UN-SPIDER says it in the same guide we use for severity: burn severity data and maps “can be used to estimate not only the soil burn severity, but the likelihood of future downstream impacts due to flooding, landslides, and soil erosion”. That impact is not produced by the median; it is produced by each specific slope with each specific storm. A fire of thousands of hectares has a perimeter and a restoration plan. Fifteen hundred small patches, each with its own slope and its own access, have none of that, and at thirty days the recovery visible in them is minimal.
We will return once more, with a scene from after the first rains, to measure the one thing that cannot be measured here yet: how much of that soil has gone downhill.
What we build with this
The hard part of this measurement was not the August scene. It was that July’s still held: reproducing it exactly, saving this time the geometry of every patch, and being able to say of each of the 1,229 what state it is in thirty days later. That, the measurement that can be repeated and compared against itself, is what we build at T3 AISAT for agriculture, water, climate and emergencies. If there was fire in your district this summer and nobody has looked again, we know how to.